Try Fund Library Premium
Free with a 30 day trial!
Gain access to
- Unlimited Watchlists
- Advanced Search Filtering
- Fund Comparisons
- Portfolio Scenarios
- Customizable PDF Reports
- Portfolio Rebalancer new
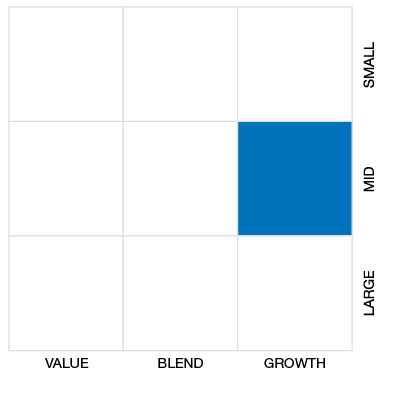
Mawer Global Small Cap Fund Series A
Global Small/Mid Cap Eq
 Click for more information on Fundata’s FundGrade
FundGrade D
Click for more information on Fundata’s FundGrade.

FundGrade A+® Rating Recipient
2021, 2020, 2019, 2018, 2017
Click for more information on Fundata’s FundGrade
|
NAVPS (05-13-2026) |
$16.60 |
|---|---|
| Change |
-$0.07
(-0.44%)
|
As at April 30, 2026
As at April 30, 2026
Legend
Compare Options
Fund Returns
Inception Return (October 02, 2007): 9.35%
| Row Heading | Return | Annualized Return | ||||||||||||
|---|---|---|---|---|---|---|---|---|---|---|---|---|---|---|
| 1 Mth | 3 Mth | 6 Mth | YTD | 1 Yr | 2 Yr | 3 Yr | 4 Yr | 5 Yr | 6 Yr | 7 Yr | 8 Yr | 9 Yr | 10 Yr | |
| Fund | 4.70% | -1.94% | -1.81% | -0.87% | 7.48% | 3.04% | 3.12% | 4.21% | -0.22% | 4.50% | 3.60% | 4.42% | 4.92% | 6.49% |
| Benchmark | 6.39% | 5.47% | 9.44% | 9.49% | 30.90% | 18.14% | 16.63% | 13.52% | 8.99% | 13.91% | 9.87% | 9.19% | 8.96% | 10.55% |
| Category Average | 5.78% | 2.08% | 5.59% | 5.42% | 23.08% | 13.50% | 12.21% | 10.03% | 5.46% | 11.02% | 7.47% | 6.42% | 6.28% | 7.44% |
| Category Rank | 185 / 288 | 263 / 286 | 245 / 285 | 268 / 286 | 244 / 270 | 233 / 257 | 236 / 247 | 210 / 230 | 198 / 209 | 183 / 190 | 149 / 169 | 110 / 141 | 100 / 130 | 97 / 124 |
| Quartile Ranking | 3 | 4 | 4 | 4 | 4 | 4 | 4 | 4 | 4 | 4 | 4 | 4 | 4 | 4 |
Monthly Return
| Return % | May | Jun | Jul | Aug | Sep | Oct | Nov | Dec | Jan | Feb | Mar | Apr |
|---|---|---|---|---|---|---|---|---|---|---|---|---|
| Fund | 3.96% | 2.27% | -2.01% | 3.94% | 0.60% | 0.48% | -0.39% | -0.56% | 1.08% | -1.29% | -5.11% | 4.70% |
| Benchmark | 5.68% | 3.76% | 2.68% | 2.65% | 2.67% | 0.79% | 0.81% | -0.85% | 3.81% | 4.82% | -5.42% | 6.39% |
Best Monthly Return Since Inception
14.01% (April 2009)
Worst Monthly Return Since Inception
-12.90% (October 2008)
Calendar Return (%)
| Return % | 2016 | 2017 | 2018 | 2019 | 2020 | 2021 | 2022 | 2023 | 2024 | 2025 |
|---|---|---|---|---|---|---|---|---|---|---|
| Fund | -0.68% | 20.81% | -2.56% | 24.39% | 14.74% | 4.82% | -17.73% | 13.92% | -3.71% | 10.22% |
| Benchmark | 7.47% | 15.40% | -7.34% | 20.09% | 11.07% | 15.50% | -13.14% | 14.59% | 18.68% | 11.95% |
| Category Average | 3.48% | 12.62% | -10.42% | 13.76% | 14.53% | 12.37% | -15.59% | 12.82% | 12.04% | 12.29% |
| Quartile Ranking | 3 | 1 | 1 | 1 | 3 | 4 | 3 | 2 | 4 | 2 |
| Category Rank | 93/ 124 | 19/ 130 | 7/ 140 | 31/ 166 | 100/ 171 | 194/ 206 | 151/ 228 | 113/ 240 | 247/ 254 | 116/ 267 |
Best Calendar Return (Last 10 years)
24.39% (2019)
Worst Calendar Return (Last 10 years)
-17.73% (2022)
Asset Allocation
| Name | Percent |
|---|---|
| International Equity | 59.82 |
| US Equity | 23.49 |
| Canadian Equity | 13.10 |
| Cash and Equivalents | 3.58 |
| Other | 0.01 |
Sector Allocation
| Name | Percent |
|---|---|
| Technology | 16.99 |
| Industrial Services | 14.74 |
| Financial Services | 13.35 |
| Healthcare | 12.11 |
| Real Estate | 8.83 |
| Other | 33.98 |
Geographic Allocation
| Name | Percent |
|---|---|
| Europe | 40.41 |
| North America | 39.40 |
| Asia | 14.04 |
| Latin America | 5.37 |
| Other | 0.78 |
Top Holdings
| Name | Percent |
|---|---|
| XPS Pensions Group PLC | 4.53 |
| Acter Group Corp Ltd | 4.12 |
| Esquire Financial Holdings Inc | 3.64 |
| Fagron NV | 3.60 |
| Gps Participacoes e Empreendimentos SA | 3.35 |
| Barrett Business Services Inc | 3.10 |
| Bravida Holding AB | 3.06 |
| Hammond Power Solutions Inc Cl A | 3.04 |
| Stella-Jones Inc | 2.89 |
| Virbac SA | 2.83 |
Equity Style
Fixed Income Style

Risk vs Return (3 Yr)
Mawer Global Small Cap Fund Series A
Median
Other - Global Small/Mid Cap Eq
3 Yr Annualized
| Standard Deviation | 11.12% | 11.98% | 12.19% |
|---|---|---|---|
| Beta | 0.64 | 0.69 | 0.73 |
| Alpha | -0.07 | -0.06 | -0.01 |
| Rsquared | 0.56% | 0.65% | 0.71% |
| Sharpe | 0.00 | -0.20 | 0.42 |
| Sortino | 0.09 | -0.28 | 0.48 |
| Treynor | 0.00 | -0.03 | 0.07 |
| Tax Efficiency | 86.65% | - | 82.26% |
| Volatility |

|
|

|
Risk Rating

Annualized Key Ratio Period Comparison
| Key Ratio | 1 Yr | 3 Yr | 5 Yr | 10 Yr |
|---|---|---|---|---|
| Standard Deviation | 9.77% | 11.12% | 11.98% | 12.19% |
| Beta | 0.67 | 0.64 | 0.69 | 0.73 |
| Alpha | -0.11 | -0.07 | -0.06 | -0.01 |
| Rsquared | 0.58% | 0.56% | 0.65% | 0.71% |
| Sharpe | 0.54 | 0.00 | -0.20 | 0.42 |
| Sortino | 0.77 | 0.09 | -0.28 | 0.48 |
| Treynor | 0.08 | 0.00 | -0.03 | 0.07 |
| Tax Efficiency | 92.95% | 86.65% | - | 82.26% |
Fund Details
| Start Date | October 02, 2007 |
|---|---|
| Instrument Type | Mutual Fund |
| Share Class | Do-It-Yourself |
| Legal Status | Trust |
| Sales Status | Open |
| Currency | CAD |
| Distribution Frequency | Annual |
| Assets ($mil) | - |
Fund Codes
| FundServ Code | Load Code | Sales Status |
|---|---|---|
| MAW150 |
Investment Objectives
The objective of the Mawer Global Small Cap Fund is to provide above-average long-term, risk-adjusted returns by investing primarily in securities of smaller companies around the world. The Fund will be primarily invested in equities and equity-related securities. The amount invested in any one country will vary depending upon the economic, investment, and market outlook and opportunities in each area.
Investment Strategy
We employ the following strategies to achieve the Fund’s objective: We seek to systematically create a broadly diversified portfolio of wealth-creating companies bought at discounts to their intrinsic value; We seek to employ a long-term holding period to allow for investor recognition or corporate growth. There are no specific limits on the portion of the Fund’s assets that may be directly invested in foreign securities or indirectly exposed to investments in foreign securities.
Portfolio Management
| Portfolio Manager |
Mawer Investment Management Ltd.
|
|---|---|
| Sub-Advisor |
- |
Management and Organization
| Fund Manager |
Mawer Investment Management Ltd. |
|---|---|
| Custodian |
State Street Trust Company Canada |
| Registrar |
International Financial Data Services (Canada) Ltd |
| Distributor |
Mawer Investment Management Ltd. |
Investment Minimums
| RSP Eligible | Yes |
|---|---|
| PAC Allowed | No |
| PAC Initial Investment | - |
| PAC Subsequent | - |
| SWP Allowed | No |
| SWP Min Balance | - |
| SWP Min Withdrawal | - |
Fees
| MER | 1.76% |
|---|---|
| Management Fee | 1.50% |
| Load | No Load |
| FE Max | - |
| DSC Max | - |
| Trailer Fee Max (FE) | - |
| Trailer Fee Max (DSC) | - |
| Trailer Fee Max (NL) | 0.00% |
| Trailer Fee Max (LL) | - |
Related articles
Try Fund Library Premium
Free with a 30 day trial!
Gain access to
- Unlimited Watchlists
- Advanced Search Filtering
- Fund Comparisons
- Portfolio Scenarios
- Customizable PDF Reports
- Portfolio Rebalancer new
