Try Fund Library Premium
Free with a 30 day trial!
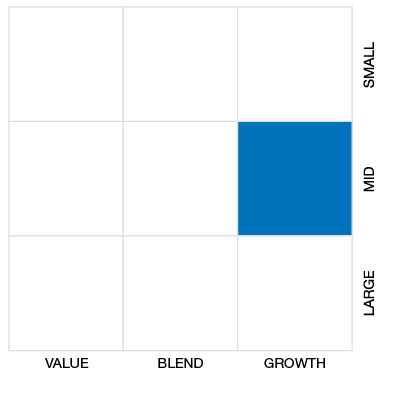
Cdn Small/Mid Cap Equity
 Click for more information on Fundata’s FundGrade
Click for more information on Fundata’s FundGrade.
|
NAVPS (04-24-2026) |
$51.45 |
|---|---|
| Change |
$0.21
(0.42%)
|
As at March 31, 2026
As at January 31, 2026
Inception Return (December 10, 1985): 8.77%
| Row Heading | Return | Annualized Return | ||||||||||||
|---|---|---|---|---|---|---|---|---|---|---|---|---|---|---|
| 1 Mth | 3 Mth | 6 Mth | YTD | 1 Yr | 2 Yr | 3 Yr | 4 Yr | 5 Yr | 6 Yr | 7 Yr | 8 Yr | 9 Yr | 10 Yr | |
| Fund | -9.40% | 0.37% | 3.40% | 0.37% | 22.86% | 11.76% | 11.45% | 6.18% | 8.56% | 16.32% | 10.29% | 8.86% | 7.95% | 8.52% |
| Benchmark | -8.97% | 11.37% | 22.75% | 11.37% | 65.80% | 35.71% | 25.85% | 14.90% | 15.67% | 26.74% | 15.15% | 12.88% | 10.53% | 12.29% |
| Category Average | -7.74% | 3.93% | 9.60% | 3.93% | 35.03% | 19.16% | 16.07% | 9.56% | 10.04% | 18.20% | 10.91% | 9.21% | 7.99% | 8.82% |
| Category Rank | 168 / 197 | 149 / 196 | 149 / 194 | 149 / 196 | 164 / 193 | 163 / 193 | 160 / 189 | 158 / 186 | 111 / 178 | 118 / 171 | 113 / 167 | 103 / 159 | 99 / 150 | 100 / 148 |
| Quartile Ranking | 4 | 4 | 4 | 4 | 4 | 4 | 4 | 4 | 3 | 3 | 3 | 3 | 3 | 3 |
| Return % | Apr | May | Jun | Jul | Aug | Sep | Oct | Nov | Dec | Jan | Feb | Mar |
|---|---|---|---|---|---|---|---|---|---|---|---|---|
| Fund | 0.82% | 8.08% | 3.02% | 0.86% | 2.90% | 1.99% | 0.55% | 0.86% | 1.59% | 1.92% | 8.70% | -9.40% |
| Benchmark | -1.83% | 7.20% | 6.19% | 1.50% | 9.34% | 8.91% | 2.30% | 5.23% | 2.39% | 8.69% | 12.56% | -8.97% |
16.95% (April 2020)
-21.55% (March 2020)
| Return % | 2016 | 2017 | 2018 | 2019 | 2020 | 2021 | 2022 | 2023 | 2024 | 2025 |
|---|---|---|---|---|---|---|---|---|---|---|
| Fund | 7.16% | 8.22% | -15.31% | 21.35% | 13.48% | 31.00% | -12.37% | 7.07% | 13.16% | 16.64% |
| Benchmark | 38.48% | 2.75% | -18.17% | 15.84% | 12.87% | 20.27% | -9.29% | 4.79% | 18.83% | 50.19% |
| Category Average | 18.01% | 3.43% | -15.15% | 16.59% | 11.91% | 22.35% | -11.32% | 6.49% | 16.84% | 24.55% |
| Quartile Ranking | 4 | 1 | 3 | 2 | 3 | 1 | 3 | 2 | 4 | 4 |
| Category Rank | 137/ 145 | 26/ 150 | 95/ 159 | 69/ 166 | 100/ 171 | 16/ 178 | 100/ 186 | 93/ 189 | 174/ 190 | 163/ 193 |
31.00% (2021)
-15.31% (2018)
| Name | Percent |
|---|---|
| Canadian Equity | 90.66 |
| International Equity | 4.26 |
| Income Trust Units | 3.67 |
| Cash and Equivalents | 1.42 |
| Name | Percent |
|---|---|
| Basic Materials | 21.59 |
| Real Estate | 16.40 |
| Energy | 12.65 |
| Industrial Goods | 11.19 |
| Consumer Goods | 8.39 |
| Other | 29.78 |
| Name | Percent |
|---|---|
| North America | 95.74 |
| Asia | 3.64 |
| Europe | 0.61 |
| Other | 0.01 |
| Name | Percent |
|---|---|
| Badger Infrastructure Solutions Ltd | 3.70 |
| CES Energy Solutions Corp | 3.69 |
| OceanaGold Corp | 3.64 |
| Savaria Corp | 3.40 |
| Aritzia Inc | 3.31 |
| Exchange Income Corp | 3.14 |
| Trisura Group Ltd | 3.13 |
| New Gold Inc | 2.91 |
| Chartwell Retirement Residences - Units | 2.78 |
| Atkinsrealis Group Inc | 2.68 |

Mackenzie Canadian Small Cap Fund Investor Series
Median
Other - Cdn Small/Mid Cap Equity
| Standard Deviation | 12.36% | 14.00% | 15.04% |
|---|---|---|---|
| Beta | 0.59 | 0.63 | 0.62 |
| Alpha | -0.03 | -0.01 | 0.01 |
| Rsquared | 0.58% | 0.59% | 0.71% |
| Sharpe | 0.64 | 0.46 | 0.50 |
| Sortino | 1.14 | 0.67 | 0.61 |
| Treynor | 0.13 | 0.10 | 0.12 |
| Tax Efficiency | 87.23% | 83.12% | 89.75% |
| Volatility |

|

|

|

| Key Ratio | 1 Yr | 3 Yr | 5 Yr | 10 Yr |
|---|---|---|---|---|
| Standard Deviation | 15.48% | 12.36% | 14.00% | 15.04% |
| Beta | 0.65 | 0.59 | 0.63 | 0.62 |
| Alpha | -0.13 | -0.03 | -0.01 | 0.01 |
| Rsquared | 0.72% | 0.58% | 0.59% | 0.71% |
| Sharpe | 1.26 | 0.64 | 0.46 | 0.50 |
| Sortino | - | 1.14 | 0.67 | 0.61 |
| Treynor | 0.30 | 0.13 | 0.10 | 0.12 |
| Tax Efficiency | 87.38% | 87.23% | 83.12% | 89.75% |
| Start Date | December 10, 1985 |
|---|---|
| Instrument Type | Mutual Fund |
| Share Class | Commission Based Advice |
| Legal Status | Trust |
| Sales Status | Capped |
| Currency | CAD |
| Distribution Frequency | Annual |
| Assets ($mil) | $177 |
| FundServ Code | Load Code | Sales Status |
|---|---|---|
| MFC4155 |
Significant long-term capital growth by investing primarily in a well-diversified portfolio of smaller Canadian companies with below-average market capitalization.
The investment approach follows a blended growth and value investment style. By constructing diversified portfolios based on a disciplined, statistically grounded, bottom-up investment approach, the investment team believes it can mitigate risk and maximize long-term investment returns for Fund investors. Generally, the Fund will not invest more than 30% of its assets in foreign securities. Generally, the Fund will be fully invested.
| Portfolio Manager |
Mackenzie Financial Corporation
|
|---|---|
| Sub-Advisor |
- |
| Fund Manager |
Mackenzie Financial Corporation |
|---|---|
| Custodian |
Canadian Imperial Bank of Commerce |
| Registrar |
Mackenzie Financial Corporation |
| Distributor |
- |
| RSP Eligible | Yes |
|---|---|
| PAC Allowed | Yes |
| PAC Initial Investment | 50 |
| PAC Subsequent | 50 |
| SWP Allowed | Yes |
| SWP Min Balance | 10,000 |
| SWP Min Withdrawal | 100 |
| MER | 2.10% |
|---|---|
| Management Fee | 1.65% |
| Load | Back Fee Only |
| FE Max | 2.50% |
| DSC Max | - |
| Trailer Fee Max (FE) | 0.50% |
| Trailer Fee Max (DSC) | - |
| Trailer Fee Max (NL) | - |
| Trailer Fee Max (LL) | - |
Try Fund Library Premium
Free with a 30 day trial!
 Fund Library