Try Fund Library Premium
For Free with a 30 day trial!
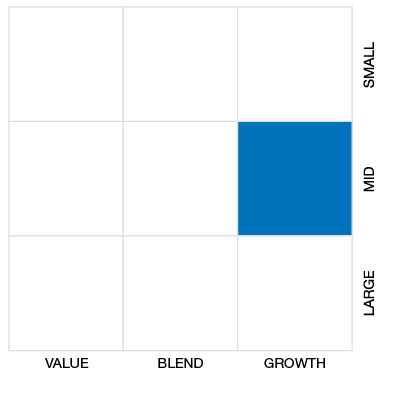
Cdn Small/Mid Cap Equity
 Click for more information on Fundata’s FundGrade
Click for more information on Fundata’s FundGrade.

2020, 2019, 2017, 2016, 2015
Click for more information on Fundata’s FundGrade
|
NAVPS (03-27-2026) |
$21.65 |
|---|---|
| Change |
$0.02
(0.09%)
|
As at February 28, 2026
As at February 28, 2026
Inception Return (January 01, 1996): 9.87%
| Row Heading | Return | Annualized Return | ||||||||||||
|---|---|---|---|---|---|---|---|---|---|---|---|---|---|---|
| 1 Mth | 3 Mth | 6 Mth | YTD | 1 Yr | 2 Yr | 3 Yr | 4 Yr | 5 Yr | 6 Yr | 7 Yr | 8 Yr | 9 Yr | 10 Yr | |
| Fund | 6.63% | 8.73% | 7.30% | 7.59% | 22.81% | 11.74% | 12.24% | 7.05% | 5.93% | 8.87% | 9.34% | 8.40% | 7.19% | 8.92% |
| Benchmark | 12.56% | 25.27% | 46.87% | 22.35% | 86.80% | 47.47% | 29.67% | 18.75% | 17.82% | 21.51% | 16.52% | 14.03% | 11.81% | 14.17% |
| Category Average | 9.19% | 15.60% | 24.20% | 12.65% | 43.95% | 25.67% | 18.76% | 12.50% | 12.43% | 14.53% | 12.25% | 10.24% | 9.09% | 10.27% |
| Category Rank | 169 / 200 | 175 / 198 | 182 / 197 | 176 / 199 | 179 / 196 | 188 / 196 | 176 / 192 | 183 / 190 | 178 / 182 | 170 / 175 | 154 / 171 | 141 / 163 | 133 / 154 | 124 / 149 |
| Quartile Ranking | 4 | 4 | 4 | 4 | 4 | 4 | 4 | 4 | 4 | 4 | 4 | 4 | 4 | 4 |
| Return % | Mar | Apr | May | Jun | Jul | Aug | Sep | Oct | Nov | Dec | Jan | Feb |
|---|---|---|---|---|---|---|---|---|---|---|---|---|
| Fund | -1.61% | 2.47% | 5.82% | 4.68% | 3.40% | -0.89% | -0.42% | 2.41% | -3.22% | 1.06% | 0.90% | 6.63% |
| Benchmark | 2.56% | -1.83% | 7.20% | 6.19% | 1.50% | 9.34% | 8.91% | 2.30% | 5.23% | 2.39% | 8.69% | 12.56% |
15.91% (April 2020)
-23.89% (March 2020)
| Return % | 2016 | 2017 | 2018 | 2019 | 2020 | 2021 | 2022 | 2023 | 2024 | 2025 |
|---|---|---|---|---|---|---|---|---|---|---|
| Fund | 18.46% | 3.11% | -11.50% | 27.48% | 17.85% | 16.83% | -19.87% | 10.94% | 11.47% | 10.19% |
| Benchmark | 38.48% | 2.75% | -18.17% | 15.84% | 12.87% | 20.27% | -9.29% | 4.79% | 18.83% | 50.19% |
| Category Average | 18.01% | 3.43% | -15.15% | 16.59% | 11.91% | 22.35% | -11.32% | 6.49% | 16.84% | 24.55% |
| Quartile Ranking | 3 | 2 | 1 | 1 | 2 | 4 | 4 | 2 | 4 | 4 |
| Category Rank | 96/ 149 | 73/ 154 | 37/ 163 | 21/ 170 | 62/ 175 | 166/ 182 | 156/ 190 | 49/ 192 | 190/ 193 | 187/ 196 |
27.48% (2019)
-19.87% (2022)
| Name | Percent |
|---|---|
| Canadian Equity | 96.32 |
| International Equity | 2.58 |
| Cash and Equivalents | 1.09 |
| Other | 0.01 |
| Name | Percent |
|---|---|
| Financial Services | 16.20 |
| Real Estate | 14.09 |
| Energy | 13.96 |
| Industrial Goods | 11.56 |
| Basic Materials | 11.19 |
| Other | 33.00 |
| Name | Percent |
|---|---|
| North America | 97.42 |
| Latin America | 2.58 |
| Name | Percent |
|---|---|
| Sprott Inc | 6.40 |
| Stella-Jones Inc | 4.61 |
| Calian Group Ltd | 4.17 |
| Skeena Resources Ltd | 4.10 |
| Hammond Power Solutions Inc Cl A | 3.58 |
| TerraVest Industries Inc | 3.57 |
| Enerflex Ltd | 3.31 |
| Jamieson Wellness Inc | 3.28 |
| Mainstreet Equity Corp | 3.21 |
| Trisura Group Ltd | 3.16 |

BMO Enterprise Fund Advisor Series
Median
Other - Cdn Small/Mid Cap Equity
| Standard Deviation | 11.54% | 13.80% | 15.43% |
|---|---|---|---|
| Beta | 0.40% | 0.49% | 0.56% |
| Alpha | 0.01% | -0.02% | 0.01% |
| Rsquared | 0.26% | 0.34% | 0.55% |
| Sharpe | 0.74% | 0.28% | 0.51% |
| Sortino | 1.52% | 0.39% | 0.62% |
| Treynor | 0.21% | 0.08% | 0.14% |
| Tax Efficiency | 85.53% | 63.44% | 80.87% |
| Volatility |

|

|

|

| Key Ratio | 1 Yr | 3 Yr | 5 Yr | 10 Yr |
|---|---|---|---|---|
| Standard Deviation | 10.53% | 11.54% | 13.80% | 15.43% |
| Beta | 0.12% | 0.40% | 0.49% | 0.56% |
| Alpha | 0.13% | 0.01% | -0.02% | 0.01% |
| Rsquared | 0.03% | 0.26% | 0.34% | 0.55% |
| Sharpe | 1.78% | 0.74% | 0.28% | 0.51% |
| Sortino | 4.38% | 1.52% | 0.39% | 0.62% |
| Treynor | 1.56% | 0.21% | 0.08% | 0.14% |
| Tax Efficiency | 89.46% | 85.53% | 63.44% | 80.87% |
| Start Date | January 01, 1996 |
|---|---|
| Instrument Type | Mutual Fund |
| Share Class | Commission Based Advice |
| Legal Status | Trust |
| Sales Status | Capped |
| Currency | CAD |
| Distribution Frequency | Annual |
| Assets ($mil) | $154 |
| FundServ Code | Load Code | Sales Status |
|---|---|---|
| BMO85179 | ||
| BMO86949 | ||
| BMO87579 |
This fund's objective is to provide long-term growth through capital appreciation, by investing primarily in a portfolio of Canadian equities and equity-related securities issued by companies with small to medium market capitalization.
These are the strategies the portfolio manager uses to try to achieve the fund’s objective: invests in equity holdings chosen through a bottom-up selection process which emphasizes growth in earnings and sales, while also taking into account the valuations of the companies so chosen. This style of investment is sometimes described as a blend of growth and value methodologies.
| Portfolio Manager |
Mawer Investment Management Ltd.
|
|---|---|
| Sub-Advisor |
- |
| Fund Manager |
BMO Investments Inc. |
|---|---|
| Custodian |
CIBC Mellon Trust Company |
| Registrar |
BMO Investments Inc. |
| Distributor |
BMO Investments Inc. |
| RSP Eligible | Yes |
|---|---|
| PAC Allowed | Yes |
| PAC Initial Investment | 50 |
| PAC Subsequent | 50 |
| SWP Allowed | Yes |
| SWP Min Balance | 10,000 |
| SWP Min Withdrawal | 100 |
| MER | 2.23% |
|---|---|
| Management Fee | 2.35% |
| Load | Choice of Front or No Load |
| FE Max | 5.00% |
| DSC Max | 6.00% |
| Trailer Fee Max (FE) | 1.00% |
| Trailer Fee Max (DSC) | 1.00% |
| Trailer Fee Max (NL) | - |
| Trailer Fee Max (LL) | - |
Try Fund Library Premium
For Free with a 30 day trial!
 Fund Library