Try Fund Library Premium
Free with a 30 day trial!
Gain access to
- Unlimited Watchlists
- Advanced Search Filtering
- Fund Comparisons
- Portfolio Scenarios
- Customizable PDF Reports
- Portfolio Rebalancer new
Ninepoint Resource Fund Class Series A
Natural Resources Equity
 Click for more information on Fundata’s FundGrade
FundGrade C
Click for more information on Fundata’s FundGrade.
|
NAVPS (05-13-2026) |
$10.44 |
|---|---|
| Change |
-$0.03
(-0.26%)
|
As at April 30, 2026
As at April 30, 2026
Legend
Compare Options
Fund Returns
Inception Return (November 29, 2021): 7.24%
| Row Heading | Return | Annualized Return | ||||||||||||
|---|---|---|---|---|---|---|---|---|---|---|---|---|---|---|
| 1 Mth | 3 Mth | 6 Mth | YTD | 1 Yr | 2 Yr | 3 Yr | 4 Yr | 5 Yr | 6 Yr | 7 Yr | 8 Yr | 9 Yr | 10 Yr | |
| Fund | 3.80% | 4.05% | 28.46% | 19.05% | 93.19% | 39.99% | 21.61% | 8.71% | - | - | - | - | - | - |
| Benchmark | -1.66% | 8.01% | 29.63% | 18.49% | 66.29% | 37.93% | 26.06% | 18.25% | 21.63% | 20.68% | 16.47% | 14.01% | 11.67% | 11.08% |
| Category Average | 0.91% | 7.24% | 30.26% | 18.57% | 70.97% | 29.98% | 22.38% | 16.31% | 19.89% | 24.84% | 16.88% | 12.66% | 11.57% | 11.02% |
| Category Rank | 12 / 114 | 89 / 114 | 76 / 113 | 68 / 114 | 14 / 112 | 12 / 108 | 72 / 107 | 103 / 106 | - | - | - | - | - | - |
| Quartile Ranking | 1 | 4 | 3 | 3 | 1 | 1 | 3 | 4 | - | - | - | - | - | - |
Monthly Return
| Return % | May | Jun | Jul | Aug | Sep | Oct | Nov | Dec | Jan | Feb | Mar | Apr |
|---|---|---|---|---|---|---|---|---|---|---|---|---|
| Fund | 5.28% | 8.25% | 5.96% | 11.73% | 18.25% | -5.73% | 2.36% | 5.41% | 14.42% | 17.84% | -14.94% | 3.80% |
| Benchmark | 3.24% | 3.09% | 1.31% | 9.67% | 11.75% | -2.92% | 9.29% | 0.11% | 9.70% | 15.01% | -4.50% | -1.66% |
Best Monthly Return Since Inception
18.25% (September 2025)
Worst Monthly Return Since Inception
-15.09% (May 2022)
Calendar Return (%)
| Return % | 2016 | 2017 | 2018 | 2019 | 2020 | 2021 | 2022 | 2023 | 2024 | 2025 |
|---|---|---|---|---|---|---|---|---|---|---|
| Fund | - | - | - | - | - | - | - | -1.34% | -0.68% | 69.13% |
| Benchmark | 36.74% | -1.69% | -15.86% | 20.06% | -7.01% | 21.57% | 12.86% | -0.78% | 19.24% | 51.44% |
| Category Average | 40.92% | -2.18% | -21.77% | 9.95% | 5.03% | 32.84% | 13.19% | 2.62% | 7.76% | 44.14% |
| Quartile Ranking | - | - | - | - | - | - | - | 4 | 4 | 1 |
| Category Rank | - | - | - | - | - | - | - | 90/ 107 | 102/ 108 | 17/ 110 |
Best Calendar Return (Last 10 years)
69.13% (2025)
Worst Calendar Return (Last 10 years)
-1.34% (2023)
Asset Allocation
| Name | Percent |
|---|---|
| Canadian Equity | 72.80 |
| International Equity | 15.52 |
| Cash and Equivalents | 6.81 |
| US Equity | 4.85 |
| Other | 0.02 |
Sector Allocation
| Name | Percent |
|---|---|
| Basic Materials | 71.32 |
| Cash and Cash Equivalent | 6.81 |
| Energy | 5.62 |
| Other | 16.25 |
Geographic Allocation
| Name | Percent |
|---|---|
| North America | 84.99 |
| Asia | 8.78 |
| Latin America | 2.13 |
| Other | 4.10 |
Top Holdings
| Name | Percent |
|---|---|
| Canadian Treasury Bill | 7.34 |
| Ninepoint Energy Fund Series A | 6.61 |
| Arizona Sonoran Copper Co Inc | 5.75 |
| Cameco Corp | 4.72 |
| Osisko Metals Inc | 4.70 |
| Lynas Rare Earths Ltd | 4.00 |
| G Mining Ventures Corp | 3.70 |
| Midnight Sun Mining Corp | 3.19 |
| AbraSilver Resource Corp | 2.95 |
| CanAlaska Uranium Ltd Cl A | 2.94 |
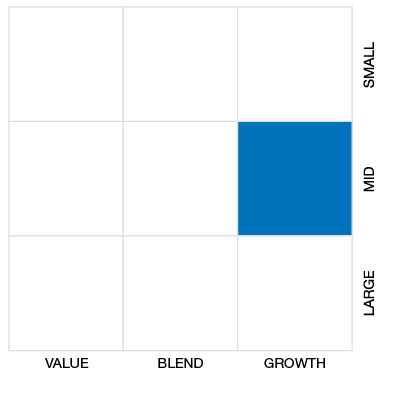
Equity Style
Fixed Income Style

Risk vs Return (3 Yr)
Ninepoint Resource Fund Class Series A
Median
Other - Natural Resources Equity
3 Yr Annualized
| Standard Deviation | 28.37% | - | - |
|---|---|---|---|
| Beta | 1.26 | - | - |
| Alpha | -0.08 | - | - |
| Rsquared | 0.68% | - | - |
| Sharpe | 0.70 | - | - |
| Sortino | 1.21 | - | - |
| Treynor | 0.16 | - | - |
| Tax Efficiency | 87.20% | - | - |
| Volatility |

|
- | - |
Risk Rating

Annualized Key Ratio Period Comparison
| Key Ratio | 1 Yr | 3 Yr | 5 Yr | 10 Yr |
|---|---|---|---|---|
| Standard Deviation | 32.93% | 28.37% | - | - |
| Beta | 1.25 | 1.26 | - | - |
| Alpha | 0.05 | -0.08 | - | - |
| Rsquared | 0.70% | 0.68% | - | - |
| Sharpe | 2.13 | 0.70 | - | - |
| Sortino | 4.26 | 1.21 | - | - |
| Treynor | 0.56 | 0.16 | - | - |
| Tax Efficiency | 91.30% | 87.20% | - | - |
Fund Details
| Start Date | November 29, 2021 |
|---|---|
| Instrument Type | Mutual Fund |
| Share Class | Commission Based Advice |
| Legal Status | Corporation |
| Sales Status | Open |
| Currency | CAD |
| Distribution Frequency | Annual |
| Assets ($mil) | - |
Fund Codes
| FundServ Code | Load Code | Sales Status |
|---|---|---|
| NPP970 |
Investment Objectives
The investment objective of the Fund is to seek to achieve long-term capital growth. The Fund invests primarily in equity and equity-related securities of companies in Canada and around the world that are involved directly or indirectly in the natural resource sector.
Investment Strategy
To achieve the Fund’s investment objective, the sub-adviser uses macro-economic research to identify the most attractive resource sub-sectors to invest in. The sub-adviser employs an opportunistic investment approach by being able to invest across the global resource universe (oil & gas, coal, uranium, renewable energy, base metals, precious metals, agriculture, forestry, water, commodity infrastructure and service companies).
Portfolio Management
| Portfolio Manager |
Ninepoint Partners LP |
|---|---|
| Sub-Advisor |
- |
Management and Organization
| Fund Manager |
Ninepoint Partners LP |
|---|---|
| Custodian |
CIBC Mellon Trust Company |
| Registrar |
CIBC Mellon Global Securities Services Company |
| Distributor |
- |
Investment Minimums
| RSP Eligible | Yes |
|---|---|
| PAC Allowed | No |
| PAC Initial Investment | - |
| PAC Subsequent | - |
| SWP Allowed | No |
| SWP Min Balance | - |
| SWP Min Withdrawal | - |
Fees
| MER | 3.63% |
|---|---|
| Management Fee | 2.50% |
| Load | Back Fee Only |
| FE Max | 5.00% |
| DSC Max | - |
| Trailer Fee Max (FE) | 1.00% |
| Trailer Fee Max (DSC) | - |
| Trailer Fee Max (NL) | - |
| Trailer Fee Max (LL) | - |
Try Fund Library Premium
Free with a 30 day trial!
Gain access to
- Unlimited Watchlists
- Advanced Search Filtering
- Fund Comparisons
- Portfolio Scenarios
- Customizable PDF Reports
- Portfolio Rebalancer new
