Try Fund Library Premium
Free with a 30 day trial!
Gain access to
- Unlimited Watchlists
- Advanced Search Filtering
- Fund Comparisons
- Portfolio Scenarios
- Customizable PDF Reports
- Portfolio Rebalancer new
Dynamic Asia Pacific Equity Fund Series A
Asia Pacific Equity
 Click for more information on Fundata’s FundGrade
FundGrade E
Click for more information on Fundata’s FundGrade.
 Click for more information on Fundata’s ESG Grade
Fundata ESG Grade B
Click for more information on Fundata’s ESG Grade.

FundGrade A+® Rating Recipient
2021, 2020
Click for more information on Fundata’s FundGrade
|
NAVPS (05-13-2026) |
$27.80 |
|---|---|
| Change |
$0.27
(0.99%)
|
As at April 30, 2026
As at February 28, 2026
As at April 30, 2026
Legend
Compare Options
Fund Returns
Inception Return (March 31, 1994): 4.14%
| Row Heading | Return | Annualized Return | ||||||||||||
|---|---|---|---|---|---|---|---|---|---|---|---|---|---|---|
| 1 Mth | 3 Mth | 6 Mth | YTD | 1 Yr | 2 Yr | 3 Yr | 4 Yr | 5 Yr | 6 Yr | 7 Yr | 8 Yr | 9 Yr | 10 Yr | |
| Fund | 5.63% | 1.77% | 2.81% | 4.65% | 17.33% | 9.63% | 0.27% | 0.74% | -7.51% | -1.00% | -0.06% | 0.56% | 1.93% | 4.00% |
| Benchmark | 10.06% | 5.41% | 9.52% | 11.89% | 36.83% | 22.20% | 19.07% | 15.10% | 9.03% | 11.83% | 9.46% | 8.10% | 8.56% | 10.19% |
| Category Average | 10.45% | 7.02% | 13.13% | 15.84% | 43.15% | 22.79% | 17.10% | 13.48% | 6.04% | 10.73% | 8.77% | 7.49% | 8.25% | 9.58% |
| Category Rank | 38 / 39 | 39 / 39 | 39 / 39 | 39 / 39 | 39 / 39 | 39 / 39 | 39 / 39 | 39 / 39 | 39 / 39 | 37 / 37 | 37 / 37 | 25 / 25 | 25 / 25 | 25 / 25 |
| Quartile Ranking | 4 | 4 | 4 | 4 | 4 | 4 | 4 | 4 | 4 | 4 | 4 | 4 | 4 | 4 |
Monthly Return
| Return % | May | Jun | Jul | Aug | Sep | Oct | Nov | Dec | Jan | Feb | Mar | Apr |
|---|---|---|---|---|---|---|---|---|---|---|---|---|
| Fund | 3.63% | 0.53% | 0.46% | 2.02% | 4.29% | 2.51% | -1.49% | -0.28% | 2.83% | 5.86% | -8.99% | 5.63% |
| Benchmark | 4.52% | 3.51% | 2.60% | 3.01% | 5.44% | 3.62% | -2.05% | -0.07% | 6.15% | 7.42% | -10.84% | 10.06% |
Best Monthly Return Since Inception
18.24% (November 1999)
Worst Monthly Return Since Inception
-20.85% (October 2008)
Calendar Return (%)
| Return % | 2016 | 2017 | 2018 | 2019 | 2020 | 2021 | 2022 | 2023 | 2024 | 2025 |
|---|---|---|---|---|---|---|---|---|---|---|
| Fund | -5.63% | 27.13% | -11.29% | 27.01% | 45.37% | -11.05% | -24.58% | -18.59% | 3.91% | 9.91% |
| Benchmark | 1.58% | 22.81% | -6.10% | 13.37% | 16.56% | -0.07% | -11.59% | 9.55% | 18.34% | 21.05% |
| Category Average | -0.76% | 27.90% | -10.72% | 18.59% | 27.03% | -2.52% | -16.64% | 4.72% | 13.15% | 20.94% |
| Quartile Ranking | 4 | 2 | 4 | 1 | 1 | 4 | 4 | 4 | 4 | 4 |
| Category Rank | 24/ 25 | 11/ 25 | 23/ 25 | 3/ 37 | 3/ 37 | 39/ 39 | 39/ 39 | 39/ 39 | 39/ 39 | 39/ 39 |
Best Calendar Return (Last 10 years)
45.37% (2020)
Worst Calendar Return (Last 10 years)
-24.58% (2022)
Asset Allocation
| Name | Percent |
|---|---|
| International Equity | 98.68 |
| Cash and Equivalents | 1.31 |
| Other | 0.01 |
Sector Allocation
| Name | Percent |
|---|---|
| Technology | 29.90 |
| Financial Services | 23.18 |
| Consumer Goods | 13.16 |
| Industrial Goods | 10.39 |
| Basic Materials | 7.71 |
| Other | 15.66 |
Geographic Allocation
| Name | Percent |
|---|---|
| Asia | 94.52 |
| Europe | 4.16 |
| North America | 1.31 |
| Other | 0.01 |
Top Holdings
| Name | Percent |
|---|---|
| Taiwan Semiconductor Manufactrg Co Ltd - ADR | 11.22 |
| Samsung Electronics Co Ltd | 9.30 |
| Australia New Zealand Banking Grp Ltd | 4.12 |
| Mitsubishi UFJ Financial Group Inc | 4.04 |
| Tencent Holdings Ltd | 3.96 |
| BHP Group Ltd | 3.79 |
| Keyence Corp | 3.79 |
| DBS Group Holdings Ltd | 3.02 |
| AIA Group Ltd | 2.89 |
| Nippon Sanso Holdings Corp | 2.74 |
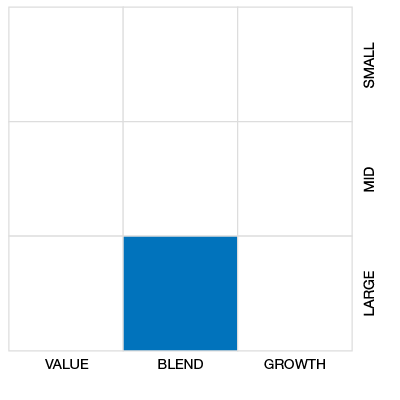
Equity Style
Fixed Income Style

Risk vs Return (3 Yr)
Dynamic Asia Pacific Equity Fund Series A
Median
Other - Asia Pacific Equity
3 Yr Annualized
| Standard Deviation | 15.81% | 19.82% | 17.60% |
|---|---|---|---|
| Beta | 0.96 | 1.09 | 1.10 |
| Alpha | -0.16 | -0.16 | -0.06 |
| Rsquared | 0.60% | 0.55% | 0.57% |
| Sharpe | -0.14 | -0.44 | 0.20 |
| Sortino | -0.14 | -0.61 | 0.20 |
| Treynor | -0.02 | -0.08 | 0.03 |
| Tax Efficiency | 100.00% | - | 89.60% |
| Volatility |

|

|
|
Risk Rating

Annualized Key Ratio Period Comparison
| Key Ratio | 1 Yr | 3 Yr | 5 Yr | 10 Yr |
|---|---|---|---|---|
| Standard Deviation | 13.84% | 15.81% | 19.82% | 17.60% |
| Beta | 0.73 | 0.96 | 1.09 | 1.10 |
| Alpha | -0.07 | -0.16 | -0.16 | -0.06 |
| Rsquared | 0.95% | 0.60% | 0.55% | 0.57% |
| Sharpe | 1.06 | -0.14 | -0.44 | 0.20 |
| Sortino | 1.48 | -0.14 | -0.61 | 0.20 |
| Treynor | 0.20 | -0.02 | -0.08 | 0.03 |
| Tax Efficiency | 100.00% | 100.00% | - | 89.60% |
Fundata ESG Metrics
Fundata ESG Score
The E, S, and G scores are averaged for each security in the portfolio, to arrive at an ESG score for each security. We take the portfolio weighted average of the ESG scores for each fund and rank them against their peers to arrive at the Fundata ESG Score from 0-100.
Fundata E Score
Three scores under the Environment bucket are averaged to yield the Fundata Environment Score for each fund from 0-100: (1) Pollution Prevention, (2) Environmental Transparency, (3) Resource Efficiency.
Fundata S Score
Six scores under the Social bucket are averaged to yield the Fundata Social Score for each fund from 0-100. (1) Compensation and Satisfaction, (2) Diversity and Rights, (3) Education and Work Conditions, (4) Community and Charity, (5) Human Rights, (6) Sustainability Integration.
Fundata G Score
Three scores under the governance bucket are averaged to yield the Fundata Governance Score for each fund from 0-100: (1) Board Effectiveness, (2) Management Ethics, (3) Disclosure and Accountability.
Powered by OWL Analytics. For more information, please contact Fundata Canada.
Fund Details
| Start Date | March 31, 1994 |
|---|---|
| Instrument Type | Mutual Fund |
| Share Class | Commission Based Advice |
| Legal Status | Trust |
| Sales Status | Open |
| Currency | CAD |
| Distribution Frequency | Annual |
| Assets ($mil) | $35 |
Fund Codes
| FundServ Code | Load Code | Sales Status |
|---|---|---|
| DYN079 | ||
| DYN3379 | ||
| DYN3479 | ||
| DYN3579 | ||
| DYN579 | ||
| DYN679 | ||
| DYN7077 | ||
| DYN779 | ||
| DYN9079 | ||
| DYN9679 | ||
| DYN9779 | ||
| DYN9879 |
Investment Objectives
Dynamic Asia Pacific Equity Fund seeks to achieve long-term capital growth primarily through investments in equity securities of businesses in the Far East. Before a fundamental change is made to the investment objective of the Fund, the prior approval of unitholders is required. This approval must be given by a resolution passed by a majority of the votes cast at a meeting of unitholders.
Investment Strategy
The Fund invests in equity securities of businesses located in, or with operations primarily based in, the Asia Pacific region which includes Australia, the People’s Republic of China, Hong Kong, India, Indonesia, Japan, Malaysia, New Zealand, Pakistan, the Philippines, Singapore, Sri Lanka, South Korea, Taiwan, Thailand and Vietnam. Based on our view of the Asian Pacific capital markets, the Fund may from time to time hold substantial investments in one or only a few of these countries.
Portfolio Management
| Portfolio Manager |
1832 Asset Management L.P. |
|---|---|
| Sub-Advisor |
- |
Management and Organization
| Fund Manager |
1832 Asset Management L.P. |
|---|---|
| Custodian |
State Street Trust Company Canada |
| Registrar |
1832 Asset Management L.P. |
| Distributor |
1832 Asset Management L.P. |
Investment Minimums
| RSP Eligible | Yes |
|---|---|
| PAC Allowed | Yes |
| PAC Initial Investment | 100 |
| PAC Subsequent | 100 |
| SWP Allowed | Yes |
| SWP Min Balance | 5,000 |
| SWP Min Withdrawal | 100 |
Fees
| MER | 2.45% |
|---|---|
| Management Fee | 2.00% |
| Load | Choice of Front or No Load |
| FE Max | 5.00% |
| DSC Max | 6.00% |
| Trailer Fee Max (FE) | 1.00% |
| Trailer Fee Max (DSC) | 1.00% |
| Trailer Fee Max (NL) | - |
| Trailer Fee Max (LL) | - |
Try Fund Library Premium
Free with a 30 day trial!
Gain access to
- Unlimited Watchlists
- Advanced Search Filtering
- Fund Comparisons
- Portfolio Scenarios
- Customizable PDF Reports
- Portfolio Rebalancer new
