Try Fund Library Premium
For Free with a 30 day trial!
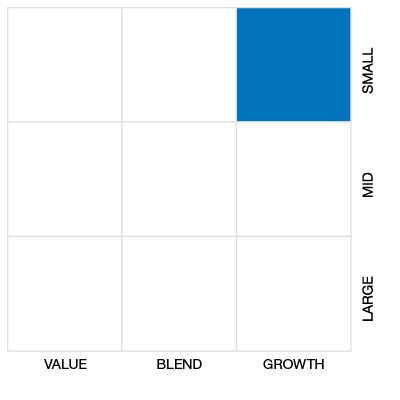
Cdn Small/Mid Cap Equity
 Click for more information on Fundata’s FundGrade
Click for more information on Fundata’s FundGrade.
 Click for more information on Fundata’s ESG Grade
Click for more information on Fundata’s ESG Grade.
|
NAVPS (02-24-2025) |
$81.15 |
|---|---|
| Change |
$0.33
(0.41%)
|
As at January 31, 2025
As at December 31, 2024
As at December 31, 2024
Inception Return (March 20, 1997): 9.17%
| Row Heading | Return | Annualized Return | ||||||||||||
|---|---|---|---|---|---|---|---|---|---|---|---|---|---|---|
| 1 Mth | 3 Mth | 6 Mth | YTD | 1 Yr | 2 Yr | 3 Yr | 4 Yr | 5 Yr | 6 Yr | 7 Yr | 8 Yr | 9 Yr | 10 Yr | |
| Fund | 0.90% | 1.02% | 2.99% | 0.90% | 12.69% | 10.94% | 7.88% | 12.39% | 9.42% | 9.74% | 7.22% | 6.54% | 8.28% | 6.87% |
| Benchmark | 0.65% | -0.04% | 3.87% | 0.65% | 20.05% | 7.28% | 4.75% | 8.02% | 9.71% | 8.82% | 5.92% | 5.16% | 8.99% | 6.03% |
| Category Average | 0.56% | 1.91% | 3.82% | 0.56% | 15.56% | 8.80% | 4.15% | 7.95% | 8.63% | 8.83% | 6.21% | 5.79% | 7.51% | 5.82% |
| Category Rank | 62 / 208 | 177 / 208 | 144 / 207 | 62 / 208 | 158 / 201 | 72 / 200 | 53 / 198 | 35 / 190 | 79 / 182 | 86 / 180 | 81 / 172 | 86 / 163 | 80 / 158 | 77 / 136 |
| Quartile Ranking | 2 | 4 | 3 | 2 | 4 | 2 | 2 | 1 | 2 | 2 | 2 | 3 | 3 | 3 |
| Return % | Feb | Mar | Apr | May | Jun | Jul | Aug | Sep | Oct | Nov | Dec | Jan |
|---|---|---|---|---|---|---|---|---|---|---|---|---|
| Fund | 0.82% | 1.39% | -1.84% | -1.49% | 4.89% | 5.55% | -0.26% | 1.63% | 0.57% | 2.23% | -2.06% | 0.90% |
| Benchmark | 0.77% | 7.49% | 0.17% | 2.65% | -1.93% | 5.81% | -1.26% | 3.80% | 1.39% | 2.69% | -3.30% | 0.65% |
14.31% (April 2020)
-25.95% (March 2020)
| Return % | 2015 | 2016 | 2017 | 2018 | 2019 | 2020 | 2021 | 2022 | 2023 | 2024 |
|---|---|---|---|---|---|---|---|---|---|---|
| Fund | -6.82% | 22.29% | 1.94% | -12.31% | 15.26% | 0.41% | 24.26% | 0.78% | 10.50% | 13.60% |
| Benchmark | -13.31% | 38.48% | 2.75% | -18.17% | 15.84% | 12.87% | 20.27% | -9.29% | 4.79% | 18.83% |
| Category Average | -6.13% | 18.01% | 3.43% | -15.15% | 16.59% | 11.91% | 22.35% | -11.32% | 6.49% | 16.84% |
| Quartile Ranking | 3 | 2 | 3 | 2 | 4 | 4 | 2 | 1 | 2 | 4 |
| Category Rank | 99/ 136 | 50/ 158 | 100/ 163 | 53/ 172 | 147/ 179 | 171/ 182 | 78/ 190 | 20/ 198 | 59/ 200 | 173/ 201 |
24.26% (2021)
-12.31% (2018)
| Name | Percent |
|---|---|
| Canadian Equity | 96.60 |
| Cash and Equivalents | 1.72 |
| Income Trust Units | 1.14 |
| US Equity | 0.54 |
| Name | Percent |
|---|---|
| Financial Services | 19.34 |
| Energy | 16.98 |
| Industrial Services | 11.02 |
| Basic Materials | 10.59 |
| Consumer Services | 8.66 |
| Other | 33.41 |
| Name | Percent |
|---|---|
| North America | 100.00 |
| Name | Percent |
|---|---|
| Canadian Western Bank | 5.22 |
| Winpak Ltd | 4.95 |
| AltaGas Ltd | 4.61 |
| iA Financial Corp Inc | 4.28 |
| Secure Energy Services Inc | 4.23 |
| Definity Financial Corp | 3.98 |
| Mullen Group Ltd | 3.90 |
| Lassonde Industries Inc Cl A | 3.89 |
| Parkland Fuel Corp | 3.71 |
| Pet Valu Holdings Ltd | 3.62 |

IA Clarington Canadian Small Cap Fund Series A
Median
Other - Cdn Small/Mid Cap Equity
| Standard Deviation | 10.75% | 17.83% | 13.97% |
|---|---|---|---|
| Beta | 0.50% | 0.65% | 0.61% |
| Alpha | 0.05% | 0.03% | 0.03% |
| Rsquared | 0.59% | 0.82% | 0.74% |
| Sharpe | 0.41% | 0.47% | 0.43% |
| Sortino | 0.80% | 0.58% | 0.45% |
| Treynor | 0.09% | 0.13% | 0.10% |
| Tax Efficiency | 94.10% | 93.87% | 93.39% |
| Volatility |

|

|

|

| Key Ratio | 1 Yr | 3 Yr | 5 Yr | 10 Yr |
|---|---|---|---|---|
| Standard Deviation | 8.31% | 10.75% | 17.83% | 13.97% |
| Beta | 0.29% | 0.50% | 0.65% | 0.61% |
| Alpha | 0.07% | 0.05% | 0.03% | 0.03% |
| Rsquared | 0.14% | 0.59% | 0.82% | 0.74% |
| Sharpe | 0.97% | 0.41% | 0.47% | 0.43% |
| Sortino | 2.58% | 0.80% | 0.58% | 0.45% |
| Treynor | 0.28% | 0.09% | 0.13% | 0.10% |
| Tax Efficiency | 98.10% | 94.10% | 93.87% | 93.39% |
The E, S, and G scores are averaged for each security in the portfolio, to arrive at an ESG score for each security. We take the portfolio weighted average of the ESG scores for each fund and rank them against their peers to arrive at the Fundata ESG Score from 0-100.
Three scores under the Environment bucket are averaged to yield the Fundata Environment Score for each fund from 0-100: (1) Pollution Prevention, (2) Environmental Transparency, (3) Resource Efficiency.
Six scores under the Social bucket are averaged to yield the Fundata Social Score for each fund from 0-100. (1) Compensation and Satisfaction, (2) Diversity and Rights, (3) Education and Work Conditions, (4) Community and Charity, (5) Human Rights, (6) Sustainability Integration.
Three scores under the governance bucket are averaged to yield the Fundata Governance Score for each fund from 0-100: (1) Board Effectiveness, (2) Management Ethics, (3) Disclosure and Accountability.
Powered by OWL Analytics. For more information, please contact Fundata Canada.
| Start Date | March 20, 1997 |
|---|---|
| Instrument Type | Mutual Fund |
| Share Class | Commission Based Advice |
| Legal Status | Trust |
| Sales Status | Open |
| Currency | CAD |
| Distribution Frequency | Annual |
| Assets ($mil) | $883 |
| FundServ Code | Load Code | Sales Status |
|---|---|---|
| CCM520 | ||
| CCM521 | ||
| CCM975 |
The Fund’s objective is to maximize long-term growth of capital by investing primarily in equity securities of small capitalization Canadian companies. The fundamental investment objective may only be changed with the approval of a majority of Securityholders at a meeting called for that purpose.
The sub-advisor: uses a fundamental, bottom-up approach to identify companies with attractive valuations, proven track records and sustainable business models. The Fund: invests primarily in equities of Canadian smaller capitalization companies. For the Fund’s investment purposes, companies with a market capitalization of less than $3 billion are considered to be smaller capitalization companies; may invest in foreign securities.
| Portfolio Manager |
iA Global Asset Management Inc. |
|---|---|
| Sub-Advisor |
QV Investors Inc.
|
| Fund Manager |
IA Clarington Investments Inc. |
|---|---|
| Custodian |
CIBC Mellon Trust Company |
| Registrar |
IA Clarington Investments Inc. |
| Distributor |
- |
| RSP Eligible | Yes |
|---|---|
| PAC Allowed | Yes |
| PAC Initial Investment | 500 |
| PAC Subsequent | 50 |
| SWP Allowed | Yes |
| SWP Min Balance | 5,000 |
| SWP Min Withdrawal | 100 |
| MER | 2.59% |
|---|---|
| Management Fee | 2.10% |
| Load | Choice of Front or No Load |
| FE Max | 5.00% |
| DSC Max | - |
| Trailer Fee Max (FE) | 1.00% |
| Trailer Fee Max (DSC) | 1.00% |
| Trailer Fee Max (NL) | - |
| Trailer Fee Max (LL) | - |
Try Fund Library Premium
For Free with a 30 day trial!
 Fund Library