Try Fund Library Premium
Free with a 30 day trial!
Gain access to
- Unlimited Watchlists
- Advanced Search Filtering
- Fund Comparisons
- Portfolio Scenarios
- Customizable PDF Reports
- Portfolio Rebalancer new
CI International Value Corporate Class (Series A shares)
International Equity
 Click for more information on Fundata’s FundGrade
FundGrade C
Click for more information on Fundata’s FundGrade.
 Click for more information on Fundata’s ESG Grade
Fundata ESG Grade D
Click for more information on Fundata’s ESG Grade.
|
NAVPS (05-13-2026) |
$21.16 |
|---|---|
| Change |
-$0.05
(-0.23%)
|
As at April 30, 2026
As at April 30, 2026
As at April 30, 2026
Legend
Compare Options
Fund Returns
Inception Return (July 23, 1996): 3.63%
| Row Heading | Return | Annualized Return | ||||||||||||
|---|---|---|---|---|---|---|---|---|---|---|---|---|---|---|
| 1 Mth | 3 Mth | 6 Mth | YTD | 1 Yr | 2 Yr | 3 Yr | 4 Yr | 5 Yr | 6 Yr | 7 Yr | 8 Yr | 9 Yr | 10 Yr | |
| Fund | 1.99% | -0.58% | 1.21% | 0.20% | 11.43% | 11.27% | 9.64% | 10.29% | 6.90% | 8.50% | 5.69% | 5.14% | 5.16% | 6.73% |
| Benchmark | 7.20% | 3.17% | 10.28% | 8.91% | 29.93% | 20.53% | 17.18% | 16.07% | 11.10% | 13.53% | 10.19% | 8.84% | 8.84% | 10.05% |
| Category Average | 4.21% | 0.57% | 3.41% | 3.49% | 15.72% | 13.20% | 11.38% | 11.43% | 7.08% | 10.19% | 7.39% | 6.54% | 6.54% | 7.70% |
| Category Rank | 776 / 863 | 681 / 855 | 593 / 845 | 670 / 851 | 579 / 796 | 497 / 747 | 482 / 712 | 463 / 694 | 386 / 674 | 495 / 638 | 487 / 605 | 461 / 542 | 396 / 484 | 341 / 431 |
| Quartile Ranking | 4 | 4 | 3 | 4 | 3 | 3 | 3 | 3 | 3 | 4 | 4 | 4 | 4 | 4 |
Monthly Return
| Return % | May | Jun | Jul | Aug | Sep | Oct | Nov | Dec | Jan | Feb | Mar | Apr |
|---|---|---|---|---|---|---|---|---|---|---|---|---|
| Fund | 3.36% | -0.22% | -0.76% | 3.50% | 3.76% | 0.16% | 1.92% | -0.89% | 0.79% | 5.97% | -8.02% | 1.99% |
| Benchmark | 4.41% | 2.18% | 0.51% | 3.32% | 3.56% | 2.68% | -0.03% | 1.29% | 5.56% | 6.62% | -9.73% | 7.20% |
Best Monthly Return Since Inception
12.36% (October 1998)
Worst Monthly Return Since Inception
-15.69% (August 1998)
Calendar Return (%)
| Return % | 2016 | 2017 | 2018 | 2019 | 2020 | 2021 | 2022 | 2023 | 2024 | 2025 |
|---|---|---|---|---|---|---|---|---|---|---|
| Fund | 2.79% | 11.67% | -2.22% | 12.45% | -1.87% | 3.98% | -3.44% | 10.22% | 10.06% | 17.71% |
| Benchmark | -1.70% | 18.37% | -6.81% | 16.27% | 8.01% | 8.97% | -10.67% | 15.74% | 11.18% | 27.50% |
| Category Average | -2.56% | 17.84% | -8.91% | 17.54% | 7.87% | 8.64% | -12.60% | 13.75% | 10.76% | 17.77% |
| Quartile Ranking | 1 | 4 | 1 | 4 | 4 | 4 | 1 | 4 | 3 | 2 |
| Category Rank | 84/ 410 | 426/ 471 | 83/ 531 | 488/ 588 | 529/ 633 | 613/ 660 | 111/ 681 | 622/ 706 | 540/ 741 | 382/ 772 |
Best Calendar Return (Last 10 years)
17.71% (2025)
Worst Calendar Return (Last 10 years)
-3.44% (2022)
Asset Allocation
| Name | Percent |
|---|---|
| International Equity | 98.54 |
| Canadian Equity | 1.58 |
| Cash and Equivalents | -0.12 |
Sector Allocation
| Name | Percent |
|---|---|
| Financial Services | 38.65 |
| Consumer Goods | 16.19 |
| Healthcare | 11.72 |
| Industrial Goods | 11.08 |
| Industrial Services | 6.25 |
| Other | 16.11 |
Geographic Allocation
| Name | Percent |
|---|---|
| Europe | 63.88 |
| Asia | 24.47 |
| Latin America | 8.85 |
| Africa and Middle East | 1.41 |
| North America | 1.38 |
| Other | 0.01 |
Top Holdings
| Name | Percent |
|---|---|
| Chubb Ltd | 3.77 |
| Deutsche Boerse AG Cl N | 3.21 |
| TotalEnergies SE | 3.15 |
| Murata Manufacturing Co Ltd | 3.11 |
| Everest RE Group Ltd | 3.02 |
| Sumitomo Mitsui Trust Holdings Inc | 2.54 |
| GSK plc | 2.40 |
| Sony Group Corp | 2.24 |
| Sanofi SA | 2.21 |
| Aon PLC Cl A | 2.13 |
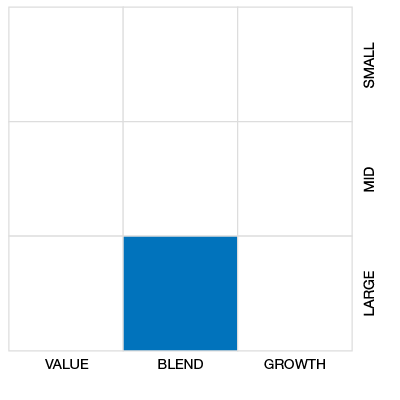
Equity Style
Fixed Income Style

Risk vs Return (3 Yr)
CI International Value Corporate Class (Series A shares)
Median
Other - International Equity
3 Yr Annualized
| Standard Deviation | 9.88% | 10.39% | 10.70% |
|---|---|---|---|
| Beta | 0.72 | 0.71 | 0.79 |
| Alpha | -0.02 | -0.01 | -0.01 |
| Rsquared | 0.74% | 0.78% | 0.83% |
| Sharpe | 0.62 | 0.42 | 0.49 |
| Sortino | 1.04 | 0.64 | 0.58 |
| Treynor | 0.08 | 0.06 | 0.07 |
| Tax Efficiency | 98.13% | 96.66% | 90.45% |
| Volatility |

|
|
|
Risk Rating

Annualized Key Ratio Period Comparison
| Key Ratio | 1 Yr | 3 Yr | 5 Yr | 10 Yr |
|---|---|---|---|---|
| Standard Deviation | 12.19% | 9.88% | 10.39% | 10.70% |
| Beta | 0.69 | 0.72 | 0.71 | 0.79 |
| Alpha | -0.07 | -0.02 | -0.01 | -0.01 |
| Rsquared | 0.75% | 0.74% | 0.78% | 0.83% |
| Sharpe | 0.75 | 0.62 | 0.42 | 0.49 |
| Sortino | 1.02 | 1.04 | 0.64 | 0.58 |
| Treynor | 0.13 | 0.08 | 0.06 | 0.07 |
| Tax Efficiency | 97.94% | 98.13% | 96.66% | 90.45% |
Fundata ESG Metrics
Fundata ESG Score
The E, S, and G scores are averaged for each security in the portfolio, to arrive at an ESG score for each security. We take the portfolio weighted average of the ESG scores for each fund and rank them against their peers to arrive at the Fundata ESG Score from 0-100.
Fundata E Score
Three scores under the Environment bucket are averaged to yield the Fundata Environment Score for each fund from 0-100: (1) Pollution Prevention, (2) Environmental Transparency, (3) Resource Efficiency.
Fundata S Score
Six scores under the Social bucket are averaged to yield the Fundata Social Score for each fund from 0-100. (1) Compensation and Satisfaction, (2) Diversity and Rights, (3) Education and Work Conditions, (4) Community and Charity, (5) Human Rights, (6) Sustainability Integration.
Fundata G Score
Three scores under the governance bucket are averaged to yield the Fundata Governance Score for each fund from 0-100: (1) Board Effectiveness, (2) Management Ethics, (3) Disclosure and Accountability.
Powered by OWL Analytics. For more information, please contact Fundata Canada.
Fund Details
| Start Date | July 23, 1996 |
|---|---|
| Instrument Type | Mutual Fund |
| Share Class | Commission Based Advice |
| Legal Status | Corporation |
| Sales Status | Open |
| Currency | CAD |
| Distribution Frequency | Quarterly |
| Assets ($mil) | $312 |
Fund Codes
| FundServ Code | Load Code | Sales Status |
|---|---|---|
| CIG14235 | ||
| CIG1705 | ||
| CIG205 | ||
| CIG705 |
Investment Objectives
This fund's objective is to obtain maximum long-term capital growth. It invests primarily in equity and equity-related securities of companies whose primary operations are outside of North America. The fund may make significant investments in any country including emerging markets and emerging industries of any market.
Investment Strategy
The portfolio adviser may use techniques such as fundamental analysis to assess growth potential. This means evaluating the financial condition and management of a company, its industry and the overall economy. As part of this evaluation, the portfolio adviser: analyzes financial data and other information sources; assesses the quality of management; conducts company interviews, where possible.
Portfolio Management
| Portfolio Manager |
CI Global Asset Management |
|---|---|
| Sub-Advisor |
Altrinsic Global Advisors, LLC
|
Management and Organization
| Fund Manager |
CI Global Asset Management |
|---|---|
| Custodian |
RBC Investor Services Trust (Canada) |
| Registrar |
CI Global Asset Management |
| Distributor |
- |
Investment Minimums
| RSP Eligible | Yes |
|---|---|
| PAC Allowed | Yes |
| PAC Initial Investment | 50 |
| PAC Subsequent | 50 |
| SWP Allowed | Yes |
| SWP Min Balance | 5,000 |
| SWP Min Withdrawal | 50 |
Fees
| MER | 2.45% |
|---|---|
| Management Fee | 2.00% |
| Load | Choice of Front or No Load |
| FE Max | 5.00% |
| DSC Max | - |
| Trailer Fee Max (FE) | 1.00% |
| Trailer Fee Max (DSC) | 0.65% |
| Trailer Fee Max (NL) | - |
| Trailer Fee Max (LL) | - |
Try Fund Library Premium
Free with a 30 day trial!
Gain access to
- Unlimited Watchlists
- Advanced Search Filtering
- Fund Comparisons
- Portfolio Scenarios
- Customizable PDF Reports
- Portfolio Rebalancer new
