Try Fund Library Premium
Free with a 30 day trial!
Gain access to
- Unlimited Watchlists
- Advanced Search Filtering
- Fund Comparisons
- Portfolio Scenarios
- Customizable PDF Reports
- Portfolio Rebalancer new
BMO Asian Growth and Income Fund Series A
Asia Pac ex-Japan Equity
 Click for more information on Fundata’s FundGrade
FundGrade E
Click for more information on Fundata’s FundGrade.
|
NAVPS (05-13-2026) |
$22.50 |
|---|---|
| Change |
$0.36
(1.62%)
|
As at April 30, 2026
As at April 30, 2026
Legend
Compare Options
Fund Returns
Inception Return (April 16, 2012): 6.63%
| Row Heading | Return | Annualized Return | ||||||||||||
|---|---|---|---|---|---|---|---|---|---|---|---|---|---|---|
| 1 Mth | 3 Mth | 6 Mth | YTD | 1 Yr | 2 Yr | 3 Yr | 4 Yr | 5 Yr | 6 Yr | 7 Yr | 8 Yr | 9 Yr | 10 Yr | |
| Fund | 11.28% | 5.79% | 11.27% | 13.60% | 40.39% | 23.25% | 15.13% | 10.97% | 5.97% | 8.35% | 5.97% | 5.89% | 5.08% | 5.96% |
| Benchmark | 11.92% | 5.77% | 10.05% | 12.71% | 40.89% | 23.90% | 19.09% | 14.14% | 8.11% | 12.06% | 9.32% | 8.21% | 8.66% | 10.60% |
| Category Average | 13.81% | 8.97% | 15.69% | 18.37% | 50.87% | 28.51% | 20.62% | 14.88% | 6.31% | 10.42% | 8.31% | 7.22% | 7.86% | 9.61% |
| Category Rank | 29 / 36 | 29 / 36 | 28 / 36 | 29 / 36 | 28 / 36 | 27 / 35 | 35 / 35 | 35 / 35 | 32 / 35 | 34 / 35 | 34 / 35 | 34 / 35 | 34 / 35 | 34 / 35 |
| Quartile Ranking | 4 | 4 | 4 | 4 | 4 | 4 | 4 | 4 | 4 | 4 | 4 | 4 | 4 | 4 |
Monthly Return
| Return % | May | Jun | Jul | Aug | Sep | Oct | Nov | Dec | Jan | Feb | Mar | Apr |
|---|---|---|---|---|---|---|---|---|---|---|---|---|
| Fund | 3.08% | 5.85% | 3.34% | -0.18% | 6.57% | 5.20% | -2.20% | 0.16% | 7.39% | 6.09% | -10.39% | 11.28% |
| Benchmark | 5.08% | 4.79% | 3.63% | 1.43% | 6.38% | 3.97% | -2.91% | 0.56% | 6.56% | 6.28% | -11.07% | 11.92% |
Best Monthly Return Since Inception
16.59% (November 2022)
Worst Monthly Return Since Inception
-10.39% (March 2026)
Calendar Return (%)
| Return % | 2016 | 2017 | 2018 | 2019 | 2020 | 2021 | 2022 | 2023 | 2024 | 2025 |
|---|---|---|---|---|---|---|---|---|---|---|
| Fund | -2.88% | 11.45% | -4.91% | 10.31% | 12.22% | -1.78% | -14.21% | -0.43% | 18.08% | 18.40% |
| Benchmark | 2.64% | 27.39% | -6.44% | 13.21% | 20.28% | -0.34% | -12.29% | 6.19% | 18.94% | 21.91% |
| Category Average | -2.50% | 31.58% | -10.09% | 15.67% | 21.94% | -6.40% | -16.58% | 2.60% | 18.11% | 24.65% |
| Quartile Ranking | 2 | 4 | 1 | 4 | 4 | 2 | 2 | 4 | 4 | 4 |
| Category Rank | 15/ 35 | 34/ 35 | 5/ 35 | 34/ 35 | 34/ 35 | 9/ 35 | 12/ 35 | 35/ 35 | 28/ 35 | 33/ 35 |
Best Calendar Return (Last 10 years)
18.40% (2025)
Worst Calendar Return (Last 10 years)
-14.21% (2022)
Asset Allocation
| Name | Percent |
|---|---|
| International Equity | 91.09 |
| Foreign Corporate Bonds | 6.65 |
| Income Trust Units | 1.46 |
| Cash and Equivalents | 0.80 |
Sector Allocation
| Name | Percent |
|---|---|
| Technology | 36.68 |
| Financial Services | 29.00 |
| Consumer Goods | 7.83 |
| Fixed Income | 6.65 |
| Telecommunications | 4.50 |
| Other | 15.34 |
Geographic Allocation
| Name | Percent |
|---|---|
| Asia | 91.80 |
| North America | 7.42 |
| Other | 0.78 |
Top Holdings
| Name | Percent |
|---|---|
| Taiwan Semiconductor Manufactrg Co Ltd | 10.89 |
| Samsung Electronics Co Ltd | 7.72 |
| Tencent Holdings Ltd | 3.93 |
| SK Hynix Inc | 3.83 |
| Hana Financial Group Inc | 3.63 |
| Alibaba Group Holding Ltd | 2.96 |
| AIA Group Ltd | 2.84 |
| SK Square Co Ltd | 2.81 |
| Goldman Sachs Fnc Crp Intl Ltd 04-Apr-2028 | 2.80 |
| SK Hynix Inc 1.75% 11-Apr-2030 | 2.61 |
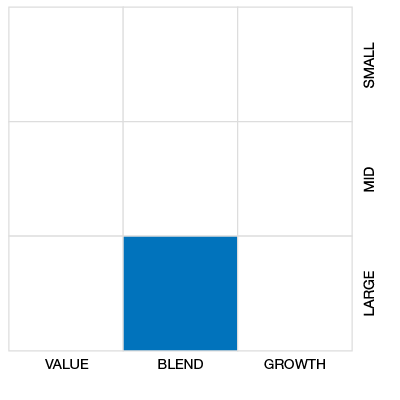
Equity Style
Fixed Income Style

Risk vs Return (3 Yr)
BMO Asian Growth and Income Fund Series A
Median
Other - Asia Pac ex-Japan Equity
3 Yr Annualized
| Standard Deviation | 14.32% | 15.40% | 12.93% |
|---|---|---|---|
| Beta | 0.95 | 0.95 | 0.87 |
| Alpha | -0.03 | -0.02 | -0.03 |
| Rsquared | 0.93% | 0.90% | 0.87% |
| Sharpe | 0.81 | 0.27 | 0.37 |
| Sortino | 1.51 | 0.44 | 0.45 |
| Treynor | 0.12 | 0.04 | 0.05 |
| Tax Efficiency | 98.38% | 93.41% | 91.82% |
| Volatility |

|

|

|
Risk Rating

Annualized Key Ratio Period Comparison
| Key Ratio | 1 Yr | 3 Yr | 5 Yr | 10 Yr |
|---|---|---|---|---|
| Standard Deviation | 19.48% | 14.32% | 15.40% | 12.93% |
| Beta | 0.96 | 0.95 | 0.95 | 0.87 |
| Alpha | 0.01 | -0.03 | -0.02 | -0.03 |
| Rsquared | 0.97% | 0.93% | 0.90% | 0.87% |
| Sharpe | 1.73 | 0.81 | 0.27 | 0.37 |
| Sortino | 3.03 | 1.51 | 0.44 | 0.45 |
| Treynor | 0.35 | 0.12 | 0.04 | 0.05 |
| Tax Efficiency | 99.32% | 98.38% | 93.41% | 91.82% |
Fund Details
| Start Date | April 16, 2012 |
|---|---|
| Instrument Type | Mutual Fund |
| Share Class | Commission Based Advice |
| Legal Status | Trust |
| Sales Status | Open |
| Currency | CAD |
| Distribution Frequency | Quarterly |
| Assets ($mil) | $217 |
Fund Codes
| FundServ Code | Load Code | Sales Status |
|---|---|---|
| BMO154 | ||
| BMO70154 |
Investment Objectives
This fund’s objective is to provide income and capital appreciation by investing in a diversified portfolio comprised of U.S. dollar-denominated convertible securities and higher yielding equity securities of Asian companies. The fund’s primary emphasis is Asian countries excluding Japan.
Investment Strategy
These are the strategies the portfolio manager uses to try to achieve the fund’s objective: invests primarily in equities and convertible bonds through a bottom-up selection process based on GARP (Growth at a Reasonable Price) methodology; uses quantitative and qualitative analyses to identify dominant, well-managed businesses in growth industries, selling at discounts to their enterprise value and growth potential.
Portfolio Management
| Portfolio Manager |
Matthews International Capital Mgmt. LLC
|
|---|---|
| Sub-Advisor |
- |
Management and Organization
| Fund Manager |
BMO Investments Inc. |
|---|---|
| Custodian |
State Street Trust Company Canada |
| Registrar |
BMO Investments Inc. State Street Trust Company Canada |
| Distributor |
BMO Investments Inc. |
Investment Minimums
| RSP Eligible | Yes |
|---|---|
| PAC Allowed | Yes |
| PAC Initial Investment | 50 |
| PAC Subsequent | 50 |
| SWP Allowed | Yes |
| SWP Min Balance | 10,000 |
| SWP Min Withdrawal | 100 |
Fees
| MER | 2.31% |
|---|---|
| Management Fee | 2.25% |
| Load | No Load |
| FE Max | - |
| DSC Max | - |
| Trailer Fee Max (FE) | - |
| Trailer Fee Max (DSC) | - |
| Trailer Fee Max (NL) | 1.00% |
| Trailer Fee Max (LL) | - |
Try Fund Library Premium
Free with a 30 day trial!
Gain access to
- Unlimited Watchlists
- Advanced Search Filtering
- Fund Comparisons
- Portfolio Scenarios
- Customizable PDF Reports
- Portfolio Rebalancer new
