Try Fund Library Premium
For Free with a 30 day trial!
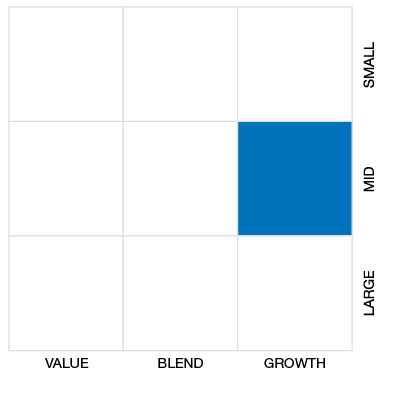
Cdn Small/Mid Cap Equity
 Click for more information on Fundata’s FundGrade
Click for more information on Fundata’s FundGrade.
|
NAVPS (03-27-2026) |
$88.25 |
|---|---|
| Change |
$0.83
(0.95%)
|
As at February 28, 2026
As at January 31, 2026
Inception Return (February 15, 2002): 11.17%
| Row Heading | Return | Annualized Return | ||||||||||||
|---|---|---|---|---|---|---|---|---|---|---|---|---|---|---|
| 1 Mth | 3 Mth | 6 Mth | YTD | 1 Yr | 2 Yr | 3 Yr | 4 Yr | 5 Yr | 6 Yr | 7 Yr | 8 Yr | 9 Yr | 10 Yr | |
| Fund | 11.66% | 19.87% | 36.02% | 19.33% | 52.48% | 32.02% | 21.31% | 16.97% | 16.05% | 17.79% | 13.93% | 12.14% | 11.20% | 11.58% |
| Benchmark | 12.56% | 25.27% | 46.87% | 22.35% | 86.80% | 47.47% | 29.67% | 18.75% | 17.82% | 21.51% | 16.52% | 14.03% | 11.81% | 14.17% |
| Category Average | 9.19% | 15.60% | 24.20% | 12.65% | 43.95% | 25.67% | 18.76% | 12.50% | 12.43% | 14.53% | 12.25% | 10.24% | 9.09% | 10.27% |
| Category Rank | 61 / 200 | 66 / 198 | 67 / 197 | 32 / 199 | 72 / 196 | 70 / 196 | 75 / 192 | 37 / 190 | 40 / 182 | 35 / 175 | 54 / 171 | 46 / 163 | 44 / 154 | 64 / 149 |
| Quartile Ranking | 2 | 2 | 2 | 1 | 2 | 2 | 2 | 1 | 1 | 1 | 2 | 2 | 2 | 2 |
| Return % | Mar | Apr | May | Jun | Jul | Aug | Sep | Oct | Nov | Dec | Jan | Feb |
|---|---|---|---|---|---|---|---|---|---|---|---|---|
| Fund | -1.58% | -1.20% | 4.44% | 3.87% | 0.97% | 5.25% | 8.83% | -0.91% | 5.22% | 0.45% | 6.87% | 11.66% |
| Benchmark | 2.56% | -1.83% | 7.20% | 6.19% | 1.50% | 9.34% | 8.91% | 2.30% | 5.23% | 2.39% | 8.69% | 12.56% |
23.45% (April 2020)
-27.80% (March 2020)
| Return % | 2016 | 2017 | 2018 | 2019 | 2020 | 2021 | 2022 | 2023 | 2024 | 2025 |
|---|---|---|---|---|---|---|---|---|---|---|
| Fund | 9.07% | 6.21% | -13.03% | 16.19% | 11.05% | 21.92% | -7.21% | 6.64% | 21.81% | 23.02% |
| Benchmark | 38.48% | 2.75% | -18.17% | 15.84% | 12.87% | 20.27% | -9.29% | 4.79% | 18.83% | 50.19% |
| Category Average | 18.01% | 3.43% | -15.15% | 16.59% | 11.91% | 22.35% | -11.32% | 6.49% | 16.84% | 24.55% |
| Quartile Ranking | 4 | 2 | 2 | 3 | 3 | 3 | 2 | 3 | 2 | 3 |
| Category Rank | 130/ 149 | 43/ 154 | 64/ 163 | 125/ 170 | 118/ 175 | 104/ 182 | 57/ 190 | 103/ 192 | 55/ 193 | 106/ 196 |
23.02% (2025)
-13.03% (2018)
| Name | Percent |
|---|---|
| Canadian Equity | 87.83 |
| Cash and Equivalents | 6.06 |
| Income Trust Units | 3.99 |
| US Equity | 1.52 |
| Foreign Bonds - Other | 0.29 |
| Other | 0.31 |
| Name | Percent |
|---|---|
| Basic Materials | 36.21 |
| Energy | 15.65 |
| Real Estate | 13.22 |
| Cash and Cash Equivalent | 6.07 |
| Technology | 5.63 |
| Other | 23.22 |
| Name | Percent |
|---|---|
| North America | 99.70 |
| Asia | 0.28 |
| Other | 0.02 |
| Name | Percent |
|---|---|
| BMO Junior Gold Index ETF (ZJG) | 6.78 |
| Major Drilling Group International Inc | 6.35 |
| K92 Mining Inc | 6.00 |
| BANK OF NOVA SCOTIA TD 2.00% 02-Feb-2026 | 5.85 |
| Hudbay Minerals Inc | 5.78 |
| Stingray Group Inc | 4.85 |
| CES Energy Solutions Corp | 4.66 |
| Alamos Gold Inc Cl A | 4.27 |
| 5N Plus Inc | 4.16 |
| Alaris Equity Partners Income Trust - Units | 3.99 |

NCM Small Companies Class Series A
Median
Other - Cdn Small/Mid Cap Equity
| Standard Deviation | 13.39% | 14.44% | 17.67% |
|---|---|---|---|
| Beta | 0.84% | 0.78% | 0.79% |
| Alpha | -0.03% | 0.02% | 0.00% |
| Rsquared | 0.85% | 0.79% | 0.82% |
| Sharpe | 1.24% | 0.91% | 0.61% |
| Sortino | 2.84% | 1.56% | 0.80% |
| Treynor | 0.20% | 0.17% | 0.14% |
| Tax Efficiency | 98.34% | 98.62% | 98.67% |
| Volatility |

|
|

|

| Key Ratio | 1 Yr | 3 Yr | 5 Yr | 10 Yr |
|---|---|---|---|---|
| Standard Deviation | 14.63% | 13.39% | 14.44% | 17.67% |
| Beta | 0.95% | 0.84% | 0.78% | 0.79% |
| Alpha | -0.18% | -0.03% | 0.02% | 0.00% |
| Rsquared | 0.86% | 0.85% | 0.79% | 0.82% |
| Sharpe | 2.83% | 1.24% | 0.91% | 0.61% |
| Sortino | 15.70% | 2.84% | 1.56% | 0.80% |
| Treynor | 0.44% | 0.20% | 0.17% | 0.14% |
| Tax Efficiency | 99.10% | 98.34% | 98.62% | 98.67% |
| Start Date | February 15, 2002 |
|---|---|
| Instrument Type | Mutual Fund |
| Share Class | Commission Based Advice |
| Legal Status | Corporation |
| Sales Status | Open |
| Currency | CAD |
| Distribution Frequency | Annual |
| Assets ($mil) | $145 |
| FundServ Code | Load Code | Sales Status |
|---|---|---|
| NRP201 | ||
| NRP202 |
The Fund is designed to achieve long-term capital appreciation by investing in securities of small and mid capitalization equities. Its portfolio may consist of all types of equity and debt obligations of issuers in Canada and the United States that may or may not be listed for trading upon the facilities of stock exchanges or other organized and regulated trading facilities in Canada and the United States.
The Fund invests in a combination of securities including but not limited to government and corporate bonds, short term debt instruments, convertible securities (including convertible bonds and warrants), income trust units, and rights, as well as common and preferred shares. These securities are primarily Canadian, but may also, as market opportunities dictate, include U.S. securities as well.
| Portfolio Manager |
NCM Asset Management Ltd. |
|---|---|
| Sub-Advisor |
Cumberland Investment Counsel Inc. |
| Fund Manager |
NCM Asset Management Ltd. |
|---|---|
| Custodian |
CIBC Mellon Trust Company |
| Registrar |
CIBC Mellon Global Securities Services Company |
| Distributor |
- |
| RSP Eligible | Yes |
|---|---|
| PAC Allowed | Yes |
| PAC Initial Investment | 5,000 |
| PAC Subsequent | 100 |
| SWP Allowed | Yes |
| SWP Min Balance | 0 |
| SWP Min Withdrawal | 0 |
| MER | 2.50% |
|---|---|
| Management Fee | 2.00% |
| Load | Choice of Front or No Load |
| FE Max | 5.00% |
| DSC Max | 3.00% |
| Trailer Fee Max (FE) | 1.00% |
| Trailer Fee Max (DSC) | 1.00% |
| Trailer Fee Max (NL) | - |
| Trailer Fee Max (LL) | - |
Try Fund Library Premium
For Free with a 30 day trial!
 Fund Library