Try Fund Library Premium
Free with a 30 day trial!
Gain access to
- Unlimited Watchlists
- Advanced Search Filtering
- Fund Comparisons
- Portfolio Scenarios
- Customizable PDF Reports
- Portfolio Rebalancer new
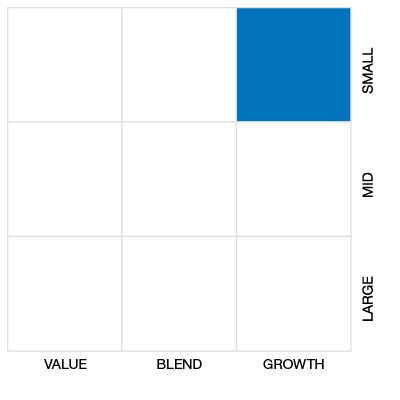
Pender Small Cap Opportunities Fund Class A
Cdn Foc Small/Mid Cap Eq
 Click for more information on Fundata’s FundGrade
FundGrade B
Click for more information on Fundata’s FundGrade.

FundGrade A+® Rating Recipient
2018, 2017, 2016, 2015, 2014
Click for more information on Fundata’s FundGrade
|
NAVPS (05-13-2026) |
$43.63 |
|---|---|
| Change |
-$0.35
(-0.79%)
|
As at April 30, 2026
As at March 31, 2026
Legend
Compare Options
Fund Returns
Inception Return (June 01, 2009): 15.37%
| Row Heading | Return | Annualized Return | ||||||||||||
|---|---|---|---|---|---|---|---|---|---|---|---|---|---|---|
| 1 Mth | 3 Mth | 6 Mth | YTD | 1 Yr | 2 Yr | 3 Yr | 4 Yr | 5 Yr | 6 Yr | 7 Yr | 8 Yr | 9 Yr | 10 Yr | |
| Fund | 11.11% | 7.14% | 13.04% | 15.26% | 35.42% | 27.61% | 24.59% | 13.59% | 7.19% | 22.71% | 14.73% | 12.42% | 11.08% | 13.26% |
| Benchmark | 6.60% | 8.05% | 21.36% | 15.59% | 61.50% | 32.17% | 24.76% | 17.02% | 13.80% | 20.17% | 14.21% | 11.92% | 10.86% | 11.51% |
| Category Average | 3.86% | 1.26% | 4.44% | 3.28% | 20.23% | 13.55% | 11.77% | 8.97% | 5.77% | 12.85% | 9.98% | 9.19% | 8.72% | 9.44% |
| Category Rank | 4 / 48 | 4 / 48 | 7 / 48 | 4 / 48 | 5 / 48 | 4 / 48 | 4 / 48 | 7 / 48 | 12 / 48 | 3 / 48 | 5 / 45 | 4 / 36 | 4 / 36 | 3 / 34 |
| Quartile Ranking | 1 | 1 | 1 | 1 | 1 | 1 | 1 | 1 | 1 | 1 | 1 | 1 | 1 | 1 |
Monthly Return
| Return % | May | Jun | Jul | Aug | Sep | Oct | Nov | Dec | Jan | Feb | Mar | Apr |
|---|---|---|---|---|---|---|---|---|---|---|---|---|
| Fund | 4.80% | 4.44% | 5.80% | 0.50% | 1.90% | 1.03% | -6.23% | 4.59% | 7.57% | 1.17% | -4.68% | 11.11% |
| Benchmark | 6.67% | 5.34% | 1.91% | 7.00% | 6.73% | 1.77% | 3.68% | 1.26% | 6.98% | 9.85% | -7.73% | 6.60% |
Best Monthly Return Since Inception
18.93% (November 2020)
Worst Monthly Return Since Inception
-28.82% (March 2020)
Calendar Return (%)
| Return % | 2016 | 2017 | 2018 | 2019 | 2020 | 2021 | 2022 | 2023 | 2024 | 2025 |
|---|---|---|---|---|---|---|---|---|---|---|
| Fund | 26.10% | 8.48% | -16.34% | 19.23% | 46.34% | 24.71% | -29.26% | 5.05% | 57.21% | 4.64% |
| Benchmark | 27.23% | 7.15% | -14.41% | 17.42% | 12.92% | 18.74% | -10.51% | 8.17% | 18.86% | 35.78% |
| Category Average | 16.27% | 9.79% | -11.20% | 21.83% | 30.06% | 13.94% | -13.64% | 7.90% | 18.68% | 9.65% |
| Quartile Ranking | 1 | 3 | 4 | 3 | 1 | 1 | 4 | 3 | 1 | 4 |
| Category Rank | 2/ 34 | 22/ 35 | 34/ 36 | 23/ 39 | 3/ 48 | 11/ 48 | 48/ 48 | 32/ 48 | 4/ 48 | 43/ 48 |
Best Calendar Return (Last 10 years)
57.21% (2024)
Worst Calendar Return (Last 10 years)
-29.26% (2022)
Asset Allocation
| Name | Percent |
|---|---|
| Canadian Equity | 81.29 |
| US Equity | 14.01 |
| International Equity | 4.07 |
| Foreign Corporate Bonds | 0.60 |
| Other | 0.03 |
Sector Allocation
| Name | Percent |
|---|---|
| Technology | 28.64 |
| Basic Materials | 13.54 |
| Energy | 10.70 |
| Industrial Goods | 10.02 |
| Utilities | 5.36 |
| Other | 31.74 |
Geographic Allocation
| Name | Percent |
|---|---|
| North America | 95.90 |
| Europe | 4.05 |
| Other | 0.05 |
Top Holdings
| Name | Percent |
|---|---|
| GENERAL FUSION SAFE | 5.09 |
| Saturn Oil & Gas Inc | 4.58 |
| Kinaxis Inc | 4.51 |
| Tantalus Systems Holding Inc | 4.13 |
| Zedcor Inc | 3.64 |
| MDA Space Ltd | 3.59 |
| Kneat.com Inc | 3.45 |
| Vitalhub Corp | 3.43 |
| Telesat Corp Cl A | 3.38 |
| PAR Technology Corp | 3.13 |
Equity Style
Fixed Income Style

Risk vs Return (3 Yr)
Pender Small Cap Opportunities Fund Class A
Median
Other - Cdn Foc Small/Mid Cap Eq
3 Yr Annualized
| Standard Deviation | 16.80% | 17.44% | 19.83% |
|---|---|---|---|
| Beta | 0.69 | 0.73 | 0.86 |
| Alpha | 0.07 | -0.02 | 0.04 |
| Rsquared | 0.34% | 0.40% | 0.56% |
| Sharpe | 1.19 | 0.32 | 0.64 |
| Sortino | 2.20 | 0.45 | 0.86 |
| Treynor | 0.29 | 0.08 | 0.15 |
| Tax Efficiency | 94.83% | 73.96% | 87.23% |
| Volatility |

|
|
|
Risk Rating

Annualized Key Ratio Period Comparison
| Key Ratio | 1 Yr | 3 Yr | 5 Yr | 10 Yr |
|---|---|---|---|---|
| Standard Deviation | 16.84% | 16.80% | 17.44% | 19.83% |
| Beta | 0.47 | 0.69 | 0.73 | 0.86 |
| Alpha | 0.08 | 0.07 | -0.02 | 0.04 |
| Rsquared | 0.20% | 0.34% | 0.40% | 0.56% |
| Sharpe | 1.76 | 1.19 | 0.32 | 0.64 |
| Sortino | 3.56 | 2.20 | 0.45 | 0.86 |
| Treynor | 0.63 | 0.29 | 0.08 | 0.15 |
| Tax Efficiency | 90.85% | 94.83% | 73.96% | 87.23% |
Fund Details
| Start Date | June 01, 2009 |
|---|---|
| Instrument Type | Mutual Fund |
| Share Class | Commission Based Advice |
| Legal Status | Trust |
| Sales Status | Capped |
| Currency | CAD |
| Distribution Frequency | Annual |
| Assets ($mil) | - |
Fund Codes
| FundServ Code | Load Code | Sales Status |
|---|---|---|
| PGF315 |
Investment Objectives
The Fund invests in a concentrated portfolio of well-managed businesses, with strong competitive positions, which are overlooked by the market and have the potential for significant capital appreciation. These businesses may be in Canada, the United States or in other foreign jurisdictions with a primary emphasis on companies with a small market capitalization.
Investment Strategy
The Manager will examine each potential investment for success in light of current economic and market conditions, its industry position, its current financial position, its growth potential, earnings estimates and the quality of its management. The Manager will focus on small and medium-sized businesses that have the potential for growth over the long term and whose shares trade at prices reflecting favourable valuations at a discount to their intrinsic value.
Portfolio Management
| Portfolio Manager |
PenderFund Capital Management Ltd.
|
|---|---|
| Sub-Advisor |
- |
Management and Organization
| Fund Manager |
PenderFund Capital Management Ltd. |
|---|---|
| Custodian |
CIBC Mellon Trust Company |
| Registrar |
CIBC Mellon Trust Company |
| Distributor |
- |
Investment Minimums
| RSP Eligible | Yes |
|---|---|
| PAC Allowed | Yes |
| PAC Initial Investment | 0 |
| PAC Subsequent | 0 |
| SWP Allowed | No |
| SWP Min Balance | - |
| SWP Min Withdrawal | - |
Fees
| MER | 2.63% |
|---|---|
| Management Fee | 2.25% |
| Load | Back Fee Only |
| FE Max | 5.00% |
| DSC Max | - |
| Trailer Fee Max (FE) | 1.00% |
| Trailer Fee Max (DSC) | - |
| Trailer Fee Max (NL) | - |
| Trailer Fee Max (LL) | - |
Related articles
Pender’s Dave Barr finds big growth in under-the-radar small-caps
By Olev Edur
Published on 06-04-2019
Try Fund Library Premium
Free with a 30 day trial!
Gain access to
- Unlimited Watchlists
- Advanced Search Filtering
- Fund Comparisons
- Portfolio Scenarios
- Customizable PDF Reports
- Portfolio Rebalancer new
