Try Fund Library Premium
Free with a 30 day trial!
Gain access to
- Unlimited Watchlists
- Advanced Search Filtering
- Fund Comparisons
- Portfolio Scenarios
- Customizable PDF Reports
- Portfolio Rebalancer new
CIBC Clean Energy Index ETF (CCLN : NEO)
North American Equity
 Click for more information on Fundata’s FundGrade
FundGrade D
Click for more information on Fundata’s FundGrade.
|
Close (05-13-2026) |
$11.30 |
|---|---|
| Change |
$0.34
(3.10%)
|
| Open | $11.30 |
|---|---|
| Day Range | $11.30 - $11.30 |
| Volume | 500 |
As at April 30, 2026
As at April 30, 2026
Legend
Compare Options
Fund Returns
Inception Return (November 16, 2021): -14.42%
| Row Heading | Return | Annualized Return | ||||||||||||
|---|---|---|---|---|---|---|---|---|---|---|---|---|---|---|
| 1 Mth | 3 Mth | 6 Mth | YTD | 1 Yr | 2 Yr | 3 Yr | 4 Yr | 5 Yr | 6 Yr | 7 Yr | 8 Yr | 9 Yr | 10 Yr | |
| Fund | 4.01% | 0.22% | -1.70% | 8.65% | 55.71% | 15.24% | -4.92% | -6.10% | - | - | - | - | - | - |
| Benchmark | 5.90% | 5.93% | 8.30% | 6.57% | 34.79% | 24.70% | 21.84% | 17.63% | 15.64% | 18.09% | 15.03% | 14.92% | 13.76% | 14.51% |
| Category Average | 7.37% | 4.10% | 4.10% | 4.34% | 20.89% | 12.90% | 13.81% | 10.71% | 7.92% | 12.85% | 9.90% | 9.82% | 9.25% | 9.88% |
| Category Rank | 140 / 191 | 144 / 190 | 133 / 188 | 50 / 190 | 3 / 186 | 86 / 178 | 173 / 173 | 161 / 161 | - | - | - | - | - | - |
| Quartile Ranking | 3 | 4 | 3 | 2 | 1 | 2 | 4 | 4 | - | - | - | - | - | - |
Monthly Return
| Return % | May | Jun | Jul | Aug | Sep | Oct | Nov | Dec | Jan | Feb | Mar | Apr |
|---|---|---|---|---|---|---|---|---|---|---|---|---|
| Fund | 6.64% | 5.38% | 7.16% | 7.30% | 10.33% | 11.11% | -5.44% | -4.32% | 8.41% | -8.11% | 4.86% | 4.01% |
| Benchmark | 5.72% | 3.56% | 2.72% | 3.12% | 5.20% | 2.01% | 1.91% | -0.28% | 0.61% | 3.77% | -3.61% | 5.90% |
Best Monthly Return Since Inception
21.63% (July 2022)
Worst Monthly Return Since Inception
-18.49% (April 2022)
Calendar Return (%)
| Return % | 2016 | 2017 | 2018 | 2019 | 2020 | 2021 | 2022 | 2023 | 2024 | 2025 |
|---|---|---|---|---|---|---|---|---|---|---|
| Fund | - | - | - | - | - | - | -23.33% | -22.11% | -20.82% | 20.00% |
| Benchmark | 14.85% | 11.54% | -2.58% | 24.09% | 10.91% | 26.72% | -9.17% | 17.51% | 28.77% | 21.74% |
| Category Average | 4.55% | 10.59% | -6.12% | 20.45% | 16.55% | 18.87% | -14.77% | 16.96% | 18.75% | 8.61% |
| Quartile Ranking | - | - | - | - | - | - | 4 | 4 | 4 | 1 |
| Category Rank | - | - | - | - | - | - | 127/ 142 | 170/ 170 | 177/ 177 | 12/ 185 |
Best Calendar Return (Last 10 years)
20.00% (2025)
Worst Calendar Return (Last 10 years)
-23.33% (2022)
Asset Allocation
| Name | Percent |
|---|---|
| US Equity | 80.85 |
| Canadian Equity | 9.20 |
| Income Trust Units | 5.85 |
| International Equity | 3.98 |
| Cash and Equivalents | 0.12 |
Sector Allocation
| Name | Percent |
|---|---|
| Energy | 26.39 |
| Utilities | 23.17 |
| Industrial Goods | 13.12 |
| Consumer Goods | 11.93 |
| Technology | 7.71 |
| Other | 17.68 |
Geographic Allocation
| Name | Percent |
|---|---|
| North America | 91.30 |
| Latin America | 4.72 |
| Multi-National | 3.98 |
Top Holdings
| Name | Percent |
|---|---|
| Plug Power Inc | 5.40 |
| Albemarle Corp | 5.26 |
| Nextracker Inc Cl A | 5.09 |
| Hannon Armstrong Sstnble Infra Cap Inc | 5.07 |
| Northland Power Inc | 4.79 |
| Brookfield Renewable Partners LP - Units | 4.72 |
| First Solar Inc | 4.63 |
| Rivian Automotive Inc Cl A | 4.63 |
| Ormat Technologies Inc | 4.61 |
| Clearway Energy Inc Cl C | 4.19 |
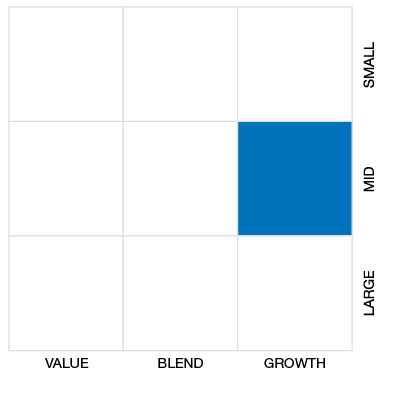
Equity Style
Fixed Income Style

Risk vs Return (3 Yr)
CIBC Clean Energy Index ETF
Median
Other - North American Equity
3 Yr Annualized
| Standard Deviation | 28.10% | - | - |
|---|---|---|---|
| Beta | 1.34% | - | - |
| Alpha | -0.28% | - | - |
| Rsquared | 0.24% | - | - |
| Sharpe | -0.17% | - | - |
| Sortino | -0.20% | - | - |
| Treynor | -0.04% | - | - |
| Tax Efficiency | - | - | - |
| Volatility |

|
- | - |
Risk Rating

Annualized Key Ratio Period Comparison
| Key Ratio | 1 Yr | 3 Yr | 5 Yr | 10 Yr |
|---|---|---|---|---|
| Standard Deviation | 22.04% | 28.10% | - | - |
| Beta | 0.32% | 1.34% | - | - |
| Alpha | 0.38% | -0.28% | - | - |
| Rsquared | 0.02% | 0.24% | - | - |
| Sharpe | 2.04% | -0.17% | - | - |
| Sortino | 3.99% | -0.20% | - | - |
| Treynor | 1.41% | -0.04% | - | - |
| Tax Efficiency | 100.00% | - | - | - |
Fund Details
| Start Date | November 16, 2021 |
|---|---|
| Instrument Type | Exchange Traded Fund (Responsible Investment) |
| Share Class | Do-It-Yourself |
| Legal Status | Trust |
| Sales Status | Open |
| Currency | CAD |
| Distribution Frequency | Annual |
| Assets ($mil) | $2 |
| 52 Week High | $11.32 |
| 52 Week Low | $6.99 |
| Annual Dividend | - |
| Annual Yield | - |
| Index | - |
| Shares Outstanding | - |
| Registered Plan Eligible | Yes |
ETF Characteristics
| Exposure | - |
|---|---|
| Asset Class High | - |
| Asset Class Medium | - |
| Asset Class Low | - |
| Leveraged | - |
| Inverse | - |
| Advisor Series | - |
| Covered Call Strategy | No |
Investment Objectives
CIBC Clean Energy Index ETF seeks to replicate, to the extent reasonably possible and before fees and expenses, the performance of a clean energy index. Currently, this ETF seeks to track the CIBC Atlas Clean Energy Select Index (or any successor thereto).
Investment Strategy
In order to achieve their investment objectives, each of the CIBC Index ETFs may invest in and hold the Constituent Securities of the applicable Index in approximately the same proportion as they are reflected in that Index or otherwise invest in a manner intended to track the performance of such Index. Each CIBC Index ETF may also hold cash and cash equivalents or other money market instruments in order to meet their current obligations. Each CIBC Index ETF may, at the discretion of the Manager
Portfolio Management
| Portfolio Manager |
CIBC Asset Management Inc. |
|---|---|
| Sub-Advisor |
- |
Management and Organization
| Fund Manager |
CIBC Asset Management Inc. |
|---|---|
| Custodian |
CIBC Mellon Trust Company |
| Registrar |
TSX Trust Company |
| Distributor |
- |
Fees
| MER | 0.41% |
|---|---|
| Management Fee | 0.35% |
Try Fund Library Premium
Free with a 30 day trial!
Gain access to
- Unlimited Watchlists
- Advanced Search Filtering
- Fund Comparisons
- Portfolio Scenarios
- Customizable PDF Reports
- Portfolio Rebalancer new
